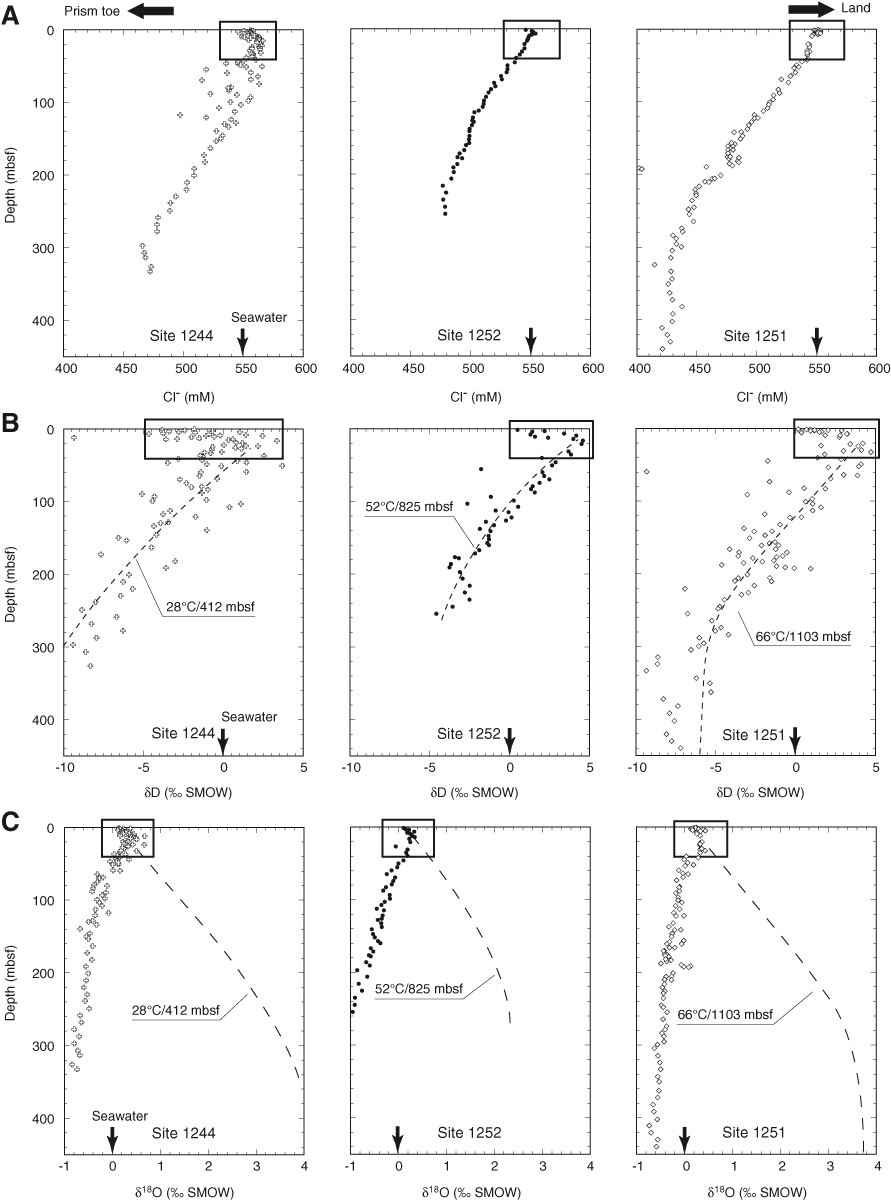
Figure F4. (A) Cl– concentrations and (B)  D and (C)
  18O values in the eastern slope basin of Hydrate Ridge. Boxes denote increases of Cl–,
  D, and
  18O within Holocene and Pleistocene sediments caused by ice sheet development during the Last Glacial Maximum. Dashed lines in B indicate best-fit average temperatures/depths of hydrogen isotopic fractionation between clay and water, which are increasing eastward. Dashed lines in C indicate predicted background levels of
  18O after correction for clay mineral dehydration. SMOW = Standard Mean Ocean Water.


 D and (C)
  18O values in the eastern slope basin of Hydrate Ridge. Boxes denote increases of Cl–,
  D, and
  18O within Holocene and Pleistocene sediments caused by ice sheet development during the Last Glacial Maximum. Dashed lines in B indicate best-fit average temperatures/depths of hydrogen isotopic fractionation between clay and water, which are increasing eastward. Dashed lines in C indicate predicted background levels of
  18O after correction for clay mineral dehydration. SMOW = Standard Mean Ocean Water.
![]()