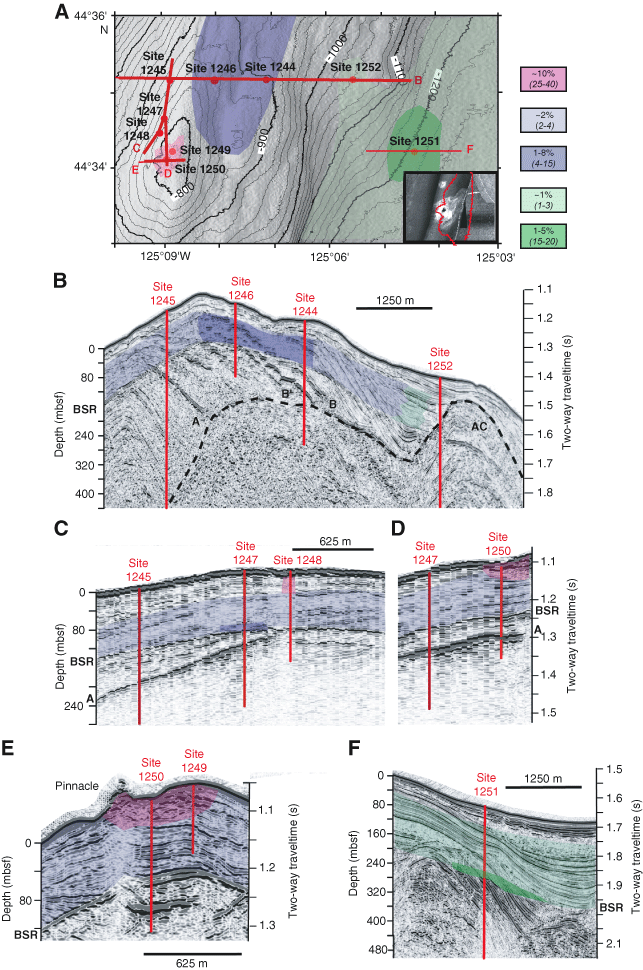
Figure F1. A. Locations of sites drilled during Leg 204. Insert shows seafloor reflectivity at the summit, with the 800 m depth contour for reference. Overlay shows gas hydrate content of the sediment averaged from the seafloor to the BSR. Red lines show the location of seismic profiles. Numbers in parentheses in the legend represent gas hydrate content of the pore space averaged over the depth intervals shown in the seismic sections. See Tréhu et al. (2004a) for determinations of gas hydrate content. B–F. Seismic sections extracted from the 3-D seismic data. Reflections at Horizons A, B, and B´ and the bottom-simulating reflection (BSR) are discussed in the text. AC prepresents the top of older, highly deformed accretionary complex sediments that are overlain by uplifted and deformed slope basin sediments (see Chevallier et al., this volume).


