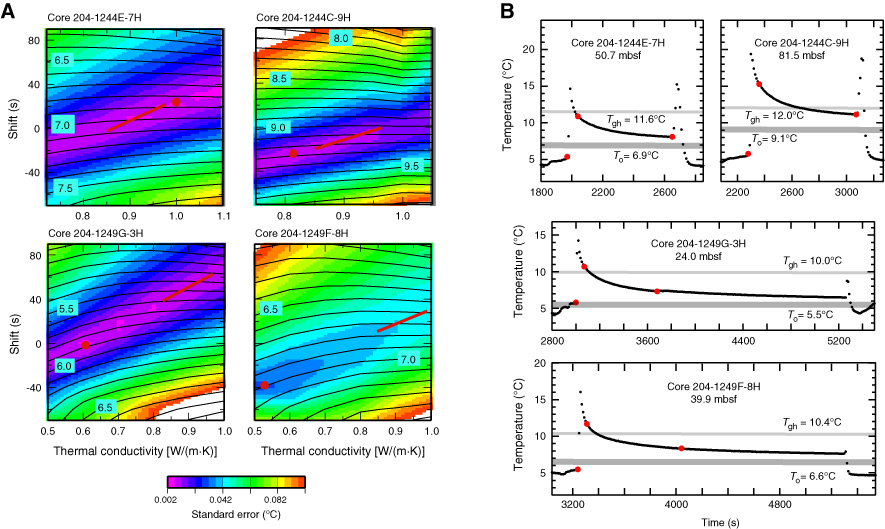
Figure F4. A. Trade-off between ts and thermal conductivity when determining To. Color represents the standard error of the solution. Contours represent best-fit To in °C. Red dots show the minimum standard error. Red lines show the range of thermal conductivities measured in the cores. B. Data (black dots) and picked values for tp, ti, and tr (red dots). The optimum data window to fit was determined empirically and was consistent for all data. The best fit To and the temperature at which gas hydrate is not stable at this depth (Tgh) are also shown. Stability boundaries determined using CSMHYD98 (Sloan, 1998) for the pore water salinity measured near the base of the gas hydrate stability zone. At shallow subseafloor depths near the summit, the local salinity at the measurement position may be higher, so Tgh shown here is an upper limit. The initial frictional heating pulse raises the temperature above the temperature for gas hydrate stability in all cases.