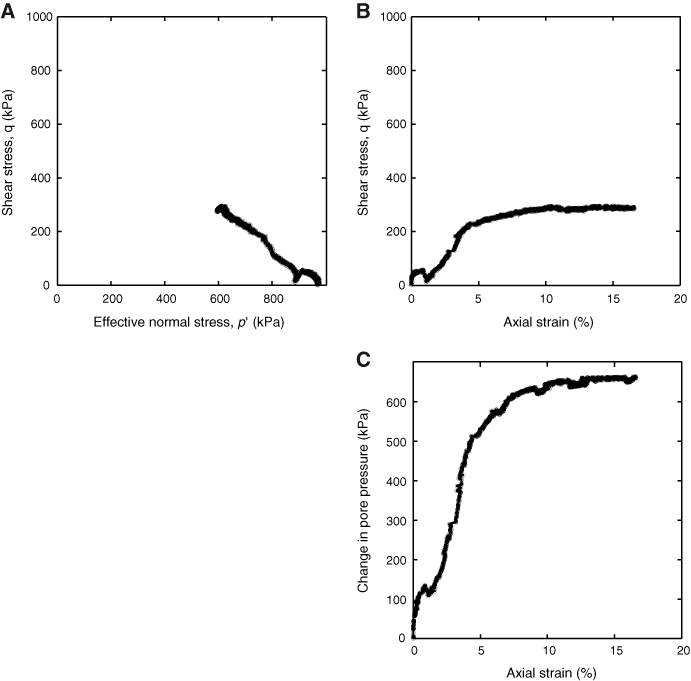
Figure F8. Shear strength results for test Sample GH101. A. Shear stress (q) vs. effective normal stress (p´) on a plane inclined at 45° from the horizontal. Each data point represents the top of a Mohr's circle and together they define a "stress path." B. Shear stress vs. axial strain. C. Change in pore pressure vs. axial strain. Note that electrical power was briefly interrupted at ~1% strain, resulting in a decreased shear stress until power was restored. At the start of shear, plot A begins in the lower right corner on the horizontal axis and moves to the left, whereas plots B and C start in the lower left corner of the horizontal axis at 0% strain and move to the right.


![]()