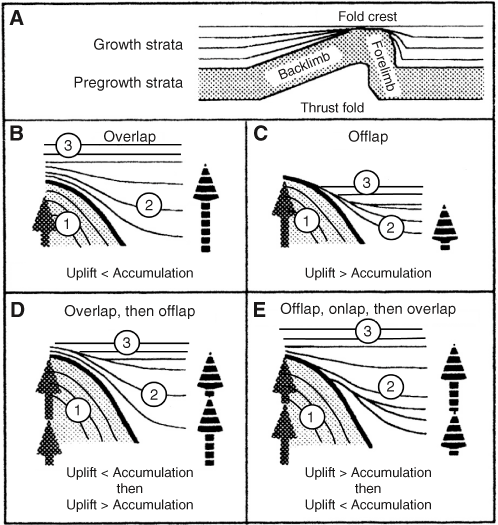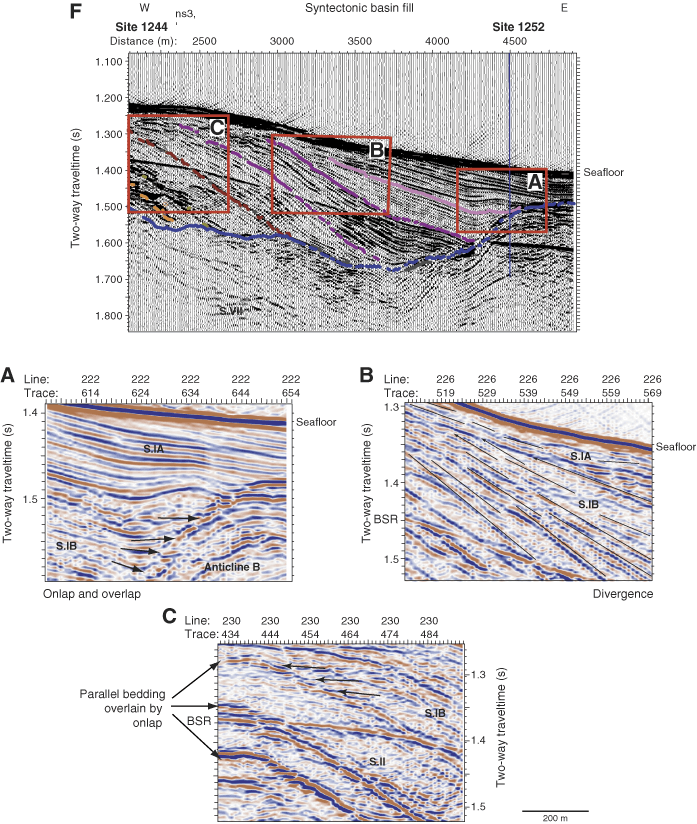
Figure F3. A. Nomenclature for growth strata deposited during thrust folding. B–E. Model of overlap, offlap, and onlap. Predictable geometries of syntectonic strata result from different ratio between the relative rates of crestal uplift and coeval sedimentation rates. Crestal uplift is measured with respect to either the base of the syntectonic strata adjacent to the fold or the position of the correlative marker beds found in both the anticline and the adjacent syncline. (B) When rates of accumulation are consistently greater than the rate of crestal uplift, overlap will occur. (C) Lower rates of accumulation versus uplift lead to offlap. (D) Reversals in the relative magnitude of these rates cause a switch in the bedding geometry. (E) Onlap occurs following offlap and a change to more rapid accumulation rates (A–E modified from Burbank and Verges, 1994). F. Examples of these characteristic seismic stratigraphic patterns in the 3-D data from southern Hydrate Ridge. BSR = bottom-simulating reflection.


![]()