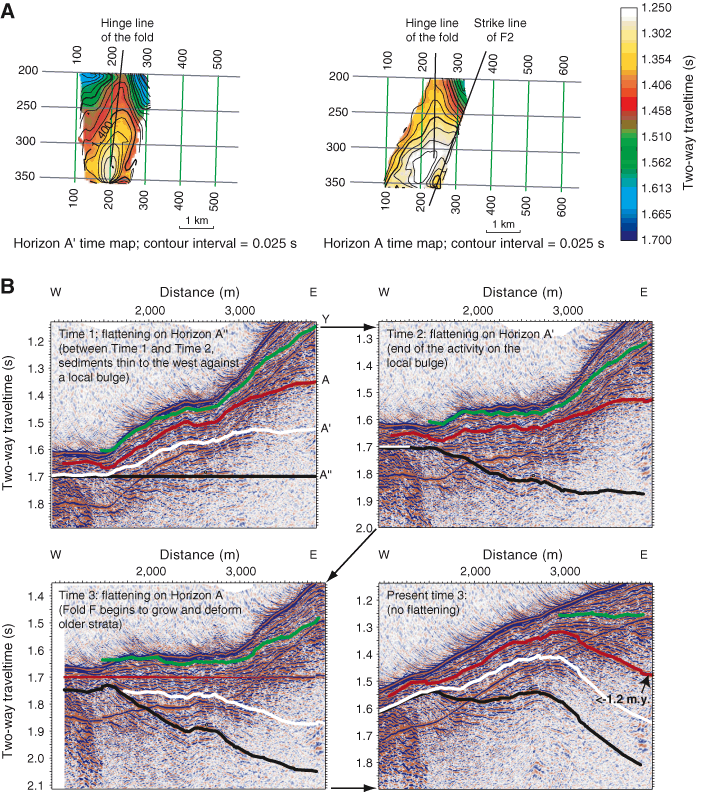
Figure F6. A. Map of Horizons A´ and A showing the strike of Fold F and Fault F2. B. Temporal evolution of Fold F shown by a series of seismic sections which have been progressively flattened on Horizons A'', A´, and A. That the presence of a local bulge active prior to ~1 Ma influences fluid flux at present is suggested by the large amplitudes beneath this structure and the large amplitude and slight relative uplift of the bottom-simulating reflection (BSR) here.


![]()