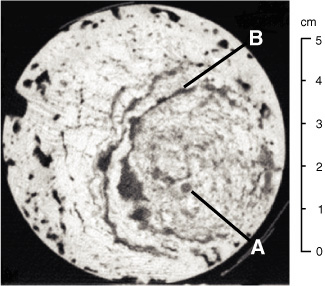
Figure F1. CT slice is a negative, dense material displayed in white (Sample 204-1249C-2H-1, 108–140 cm). Black = gas, dark gray = gas hydrate. Hydrate concentrates on the lower right side of the core. A = grain of hydrate, B = concentric structures comparable to veinlets. Sediment outside of this structure encloses gas bubbles (black), which are likely to be generated during core recovery because of their alignment to the margin of the core.


![]()