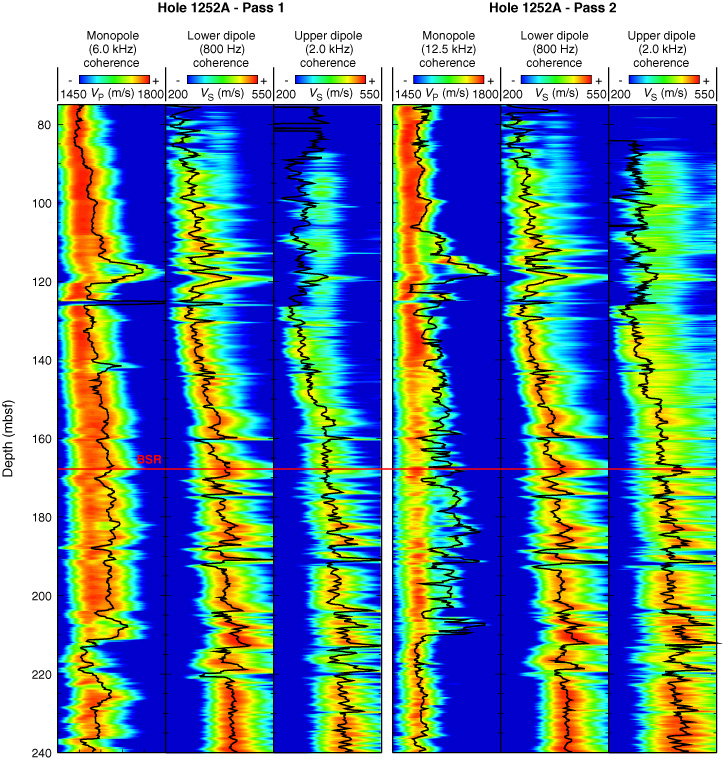
Figure F14. Results of the slowness-time coherence analysis of all the sonic logging waveforms recorded in Hole 1252A to derive the velocity logs. The colors indicate the coherence across the eight-receiver array corresponding to any velocity integrated over the entire time window. The black line indicates the final result. The gray dots indicate local maxima in coherence that could be interpreted as arrivals. BSR = bottom-simulating reflector.