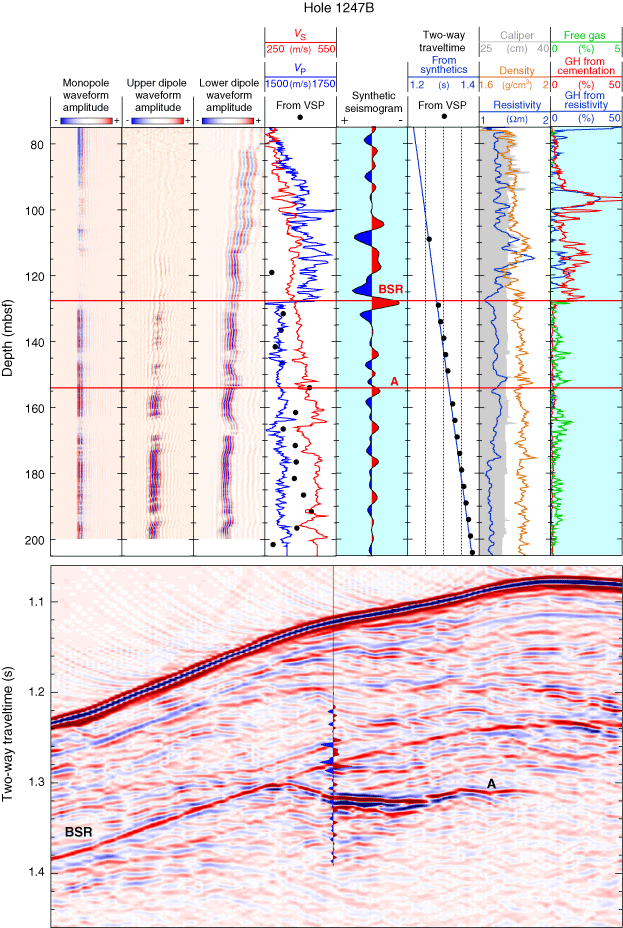
Figure F9. Wireline logs associated with the presence of gas hydrate (GH) in Hole 1247B. The synthetic seismogram and the gas hydrate concentration profiles were calculated from these logs. The velocity profile and time/depth relationship derived from the vertical seismic profile (VSP) (black dots) can be compared to the VP log and to the time/depth relationship derived by correlation between the synthetic seismogram and the seismic data. The interval velocities calculated from the VSP have been smoothed by a five-sample moving average window. The synthetic seismogram is superimposed on a short east-west transect of the 3-D seismic survey for identification of the correlations. BSR = bottom-simulating reflector, A = Horizon A.


![]()