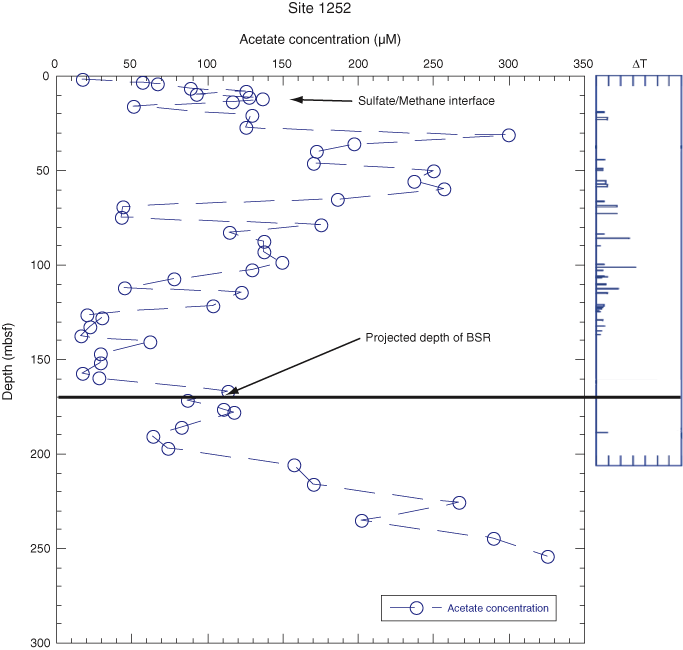
Figure F8. Plot of acetate ion concentration with depth for Site 1252. The panel to the right shows low temperature anomalies recorded by infrared camera scans (blue spikes), which indicate likely areas of gas hydrate decomposition in the recovered core. There is no methanogen or resistivity-at-the-bit (RAB) data for this site. Note the general correspondence of higher concentrations of acetate with gas hydrate accumulations, the bottom-simulating reflector (BSR), and a buildup below the BSR with low concentrations of methanogens. The overall increase in acetate concentration below the BSR may be due to a combination of lithology change and fluid from another system not sampled at the other sites of Leg 204.  T = temperature change.


 T = temperature change.
![]()