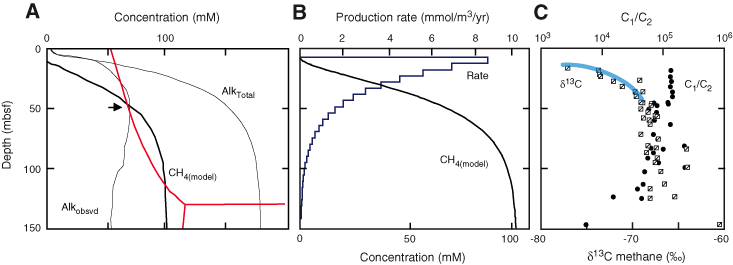
Figure F4. A. Modeled concentration vs. depth profile of methane estimated from projected and measured alkalinity concentrations as a function of depth at Site 1244. Red lines denote thermodynamic phase boundaries, showing that in situ methane production at this site reaches saturation levels with respect to gas hydrate at ~50 mbsf (shown by arrow). B. Methane production rates estimated from steady-state assumptions and exponential curve fit of alkalinity and methane concentration profiles. C. Gas composition and isotopic composition of methane at Site 1244, which indicate a biogenic methane source (see Claypool et al., this volume). The high rates of methane production in the upper 50 mbsf correspond to the very light isotopic composition of the methane (highlighted by blue line).


![]()