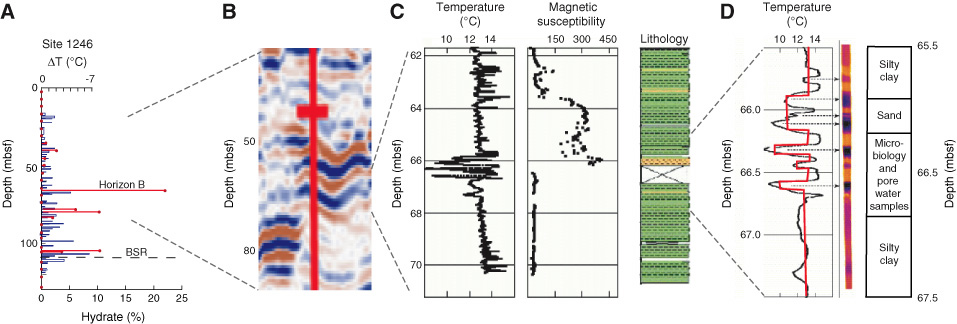
Figure F6. Nested view of data from Horizon B in Hole 1246B. A. Amount of gas hydrate estimated from pore water Cl– anomalies in the entire hole (red dots), expressed as the percentage of pore space occupied by gas hydrate. B. Seismic image of Horizon B. C. IR temperature anomalies, magnetic susceptibility, and lithologic log for Core 204-1246B-8H showing the magnetic signature of a thick turbidite sequence. Large IR anomalies are associated with coarse-grained sediments (yellow) at the base of this turbidite. A similar turbidite sequence was observed in Core 204-1246B-7H. D. Detail of the 2-m-thick zone of IR anomalies. Black line is temperature recorded along the center line of the IR image of the core (yellow = 14°C, black = 8°C). The red line shows the simplified temperature profile used by Tréhu et al. (2004b) to estimate an average gas hydrate content of ~28% in the pore space in this interval from IR data. This estimate is similar to the estimate of 22% obtained from a pore water sample from this zone.