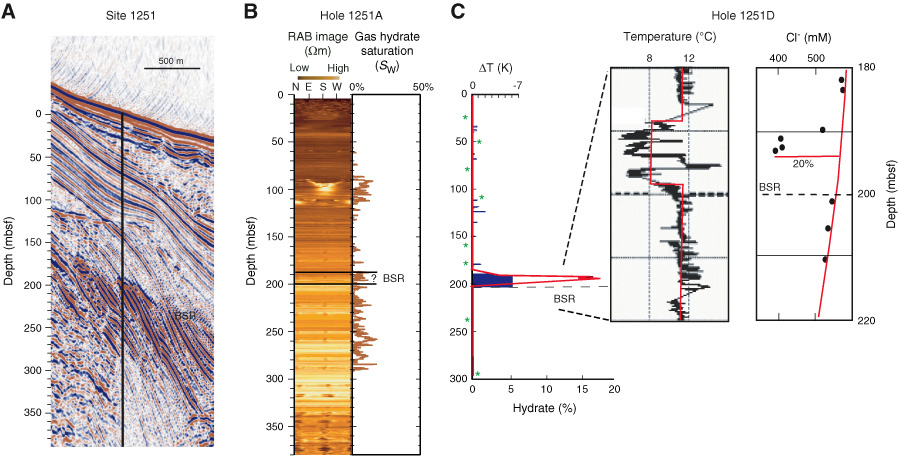
Figure F7. Data from Site 1251 illustrate lateral variability among holes a few tens of meters apart at the same site. A. Vertical slice through the seismic data. Note variable amplitude and character of the bottom-simulating reflector (BSR). Site 1251 sampled a spot within the slope basin east of Hydrate Ridge (Fig. F2) where the BSR was unusually bright. B. Resistivity-at-the-bit (RAB) image from LWD data in Hole 1251A. Gas hydrate saturation calculated from the RAB data is also shown (note: because gas hydrate and free gas both increase the electrical resistivity, below the BSR, this should be interpreted as free gas saturation). In Hole 1251A, the presence of gas hydrate is indicated at 90–110 mbsf and free gas is indicated below the BSR, at 190–200 mbsf. The 10-m uncertainty in BSR depth is due to uncertainty in the seismic velocity used to convert the seismic data to depth. C. Gas hydrate concentration estimated from Cl– (red line) and pressure core sampling (PCS) (green stars) data (Tréhu et al., 2004b) compared to IR temperature anomalies (blue bars). Three out of five PCS cores indicate methane supersaturation, although no Cl– anomalies and very few IR anomalies were observed shallower than 190 mbsf. The inset shows a zone of very large IR and Cl– anomalies at 188–200 mbsf. In Hole 1251B, the only other deep cored hole at this site, this depth interval was not recovered. Initial interpretation of the RAB data in B was that the BSR was at 190 mbsf and that there was free gas below the BSR but no significant gas hydrate deposit above the BSR in this hole. The difference in BSR depth between Hole 1251A and 1251D, located ~40 m away, was attributed to uncertainty in BSR depth (note short wavelength variations in BSR depth in the seismic data) and uncertainties in the drilling depths. An alternative interpretation is that the BSR is at 200 mbsf at 1251A and 1251D and that the upper 12 m of the deep resistivity anomaly at 1251A is due to gas hydrate.