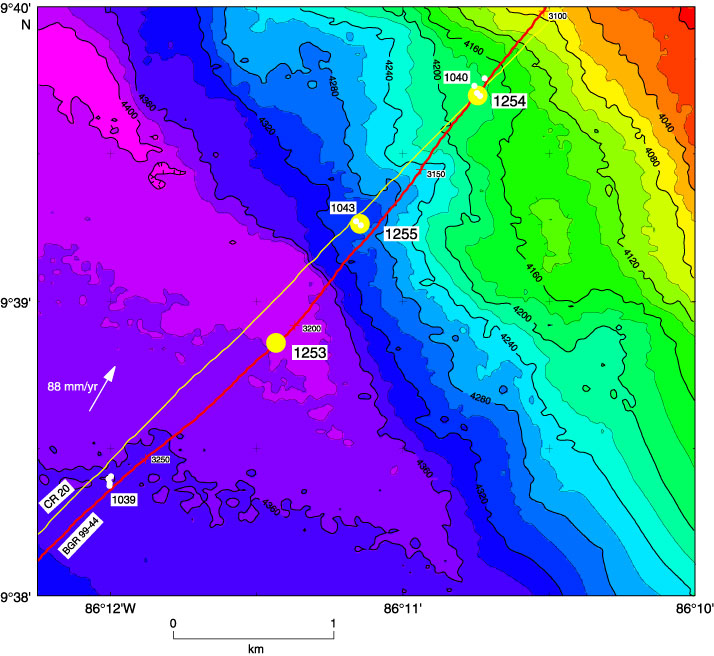
Figure F3. Bathymetric map of the Leg 205 drilling area showing Leg 205 (large yellow dots) and 170 (small white dots) drill sites. Seismic profiles are shown by the thick red (Fig. F24) (BGR-99-44; C. Reichert and C. Ranero, pers. comm., 2001) and thin yellow (CR-20; Shipley et al., 1992) lines. Leg 170 drill sites were based on seismic profile CR-20 (thin yellow line). The segment of multichannel seismic profile BGR 99-44 (thick red line) across Sites 1253 and 1039 is also shown in Figure F22. Numbers along the BGR 99-44 seismic line are shotpoints. The white arrow gives the convergence direction (N30°E) and rate (88 mm/yr) (DeMets et al., 1990). The location of the map is shown in Figure F2; bathymetric contours are in meters. The bathymetric map is an integration of the compilation by Ranero and von Huene (2000) and Simrad data from E. Flueh (pers. comm., 2000).