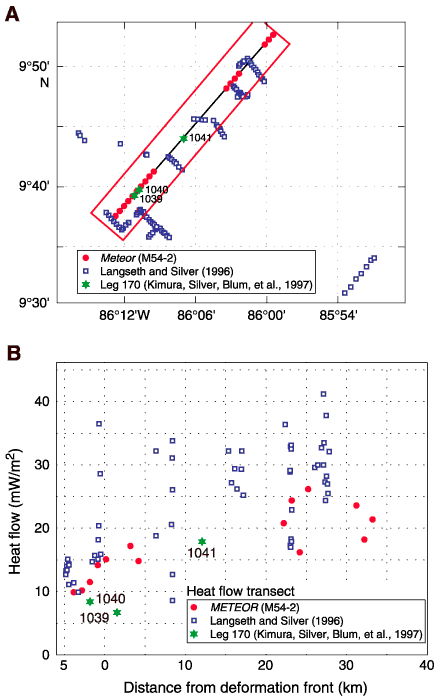
Figure F8. A. Heat flow measurements in the Leg 205 study area. The red box shows data projected onto a line (blue) across the Leg 205 and 170 drill sites, which are shown below. The Meteor and Langseth and Silver (1996) data are from shallow penetration probes, and the Leg 170 data are from deeper penetration boreholes at Sites 1039, 1040, and 1043. B. Heat flow projected onto a line across the Leg 205 and 170 drill sites. The x-axis shows the distance from the deformation front.


![]()