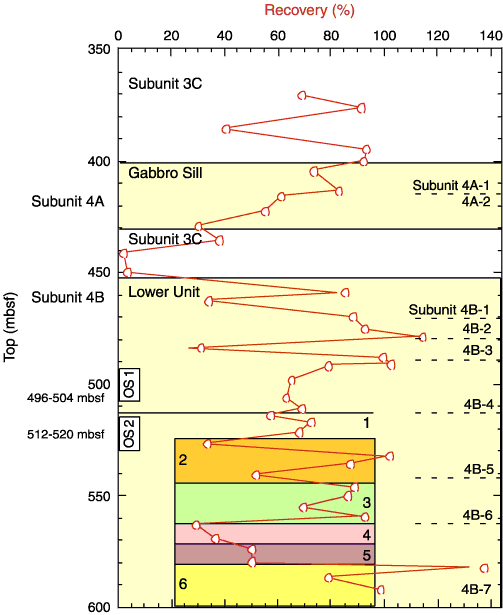
Figure F32. Core recovery plot of Hole 1253A from 370 to 600 mbsf. Indicated are the different units encountered during the drilling, the limit of each subdivision within Subunit 4A, the gabbro sill, and Subunit 4B. Different colored areas indicate the following observations. 1 = location of the cryptocrystalline basaltic texture, 2 = higher number of magmatic contacts, 3 = more veins or voids filled with holocrystalline and cryptocrystalline groundmass/altered glass, clay, and zeolites, 4 = up to 5% degree of alteration within 1 m of Section 205-1253A-37R-1 and higher abundance of voids filled with clays and zeolites ending in an homogeneous microcrystalline gabbro, 5 = increasing number of centimeter-scale fractures and veins, 6 = very homogeneous microcrystalline to fine-grained gabbro with very weak magmatic contacts. Also indicated are the positions of the two OsmoSamplers (OS).


![]()