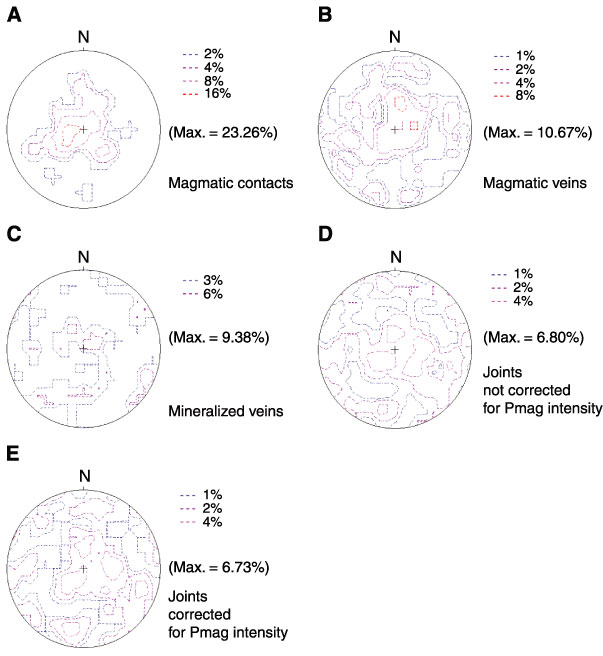
Figure F53. Contour plot (equal area, lower hemisphere) of poles to (A) magmatic contacts, (B) magmatic veins, (C) mineralized veins, and (D) joints after paleomagnetic (Pmag) reorientation and (E) joints filtered to remove low magnetic intensity intervals. Max. = maximum.


![]()