Figure F55.
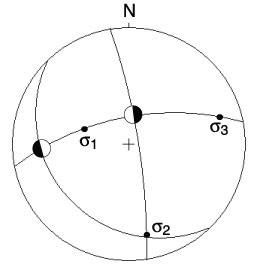
Stereographic plot (equal area, lower hemisphere) of the conjugate set of reverse faults shown in Figure
F54
. The black and white split symbols indicate the sense of movement along the plane (black = down, white = up).