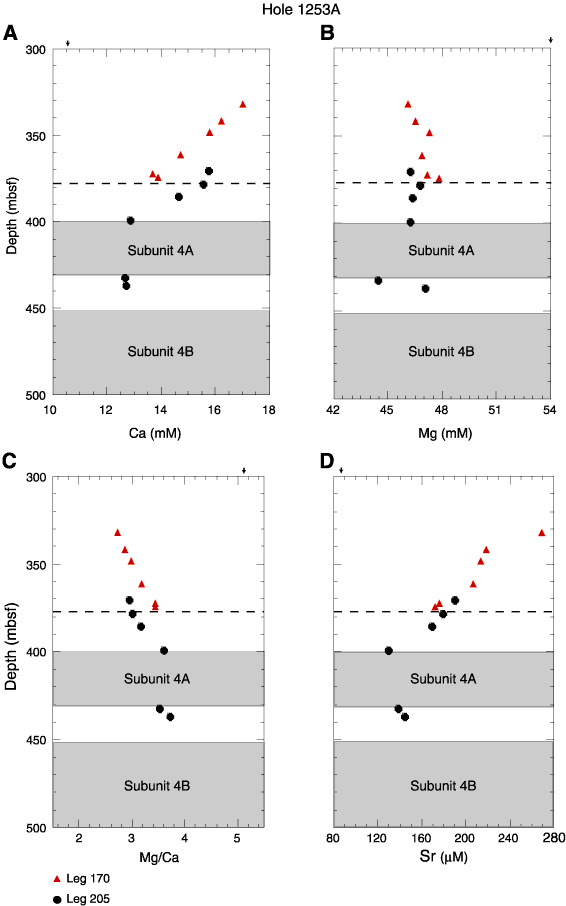
Figure F72. Depth profiles of (A) Ca, (B) Mg, (C) Mg/Ca, and (D) Sr. Arrows = seawater concentration. Dashed line = sill depth at Site 1039. Error bars are smaller than or comparable to symbol size (see "Inorganic Geochemistry" in the "Explanatory Notes" chapter). Leg 170 Sr data provided by Scripps Institution of Oceanography.