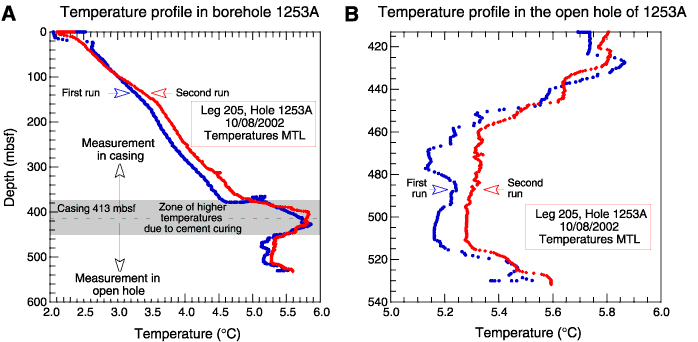
Figure F82. A. Temperatures recorded with the miniaturized temperature data logger (MTL) during lowering of the Temperature/Acceleration/Pressure tool down through the borehole. Both runs are shown and indicate a rather constant gradient in the casing, the presumed influence of the cement curing, and below the casing shoe, the temperature profiles in the open hole. B. Magnification of the open hole record. Increased temperatures of run 2 vs. run 1 indicate that the temperature had not yet reached equilibrium state.


![]()