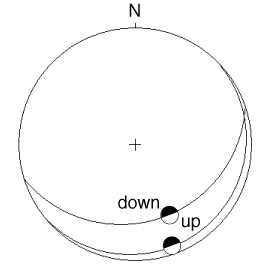
Figure F25. Stereographic plot (equal area and lower hemisphere) of the foliation and Riedel shear surfaces defining the reverse faults in the interval 205-1254A-8R-5, 0-24 cm. The black-and-white split symbols indicate the sense of movement along the plane (black = down, white = up).