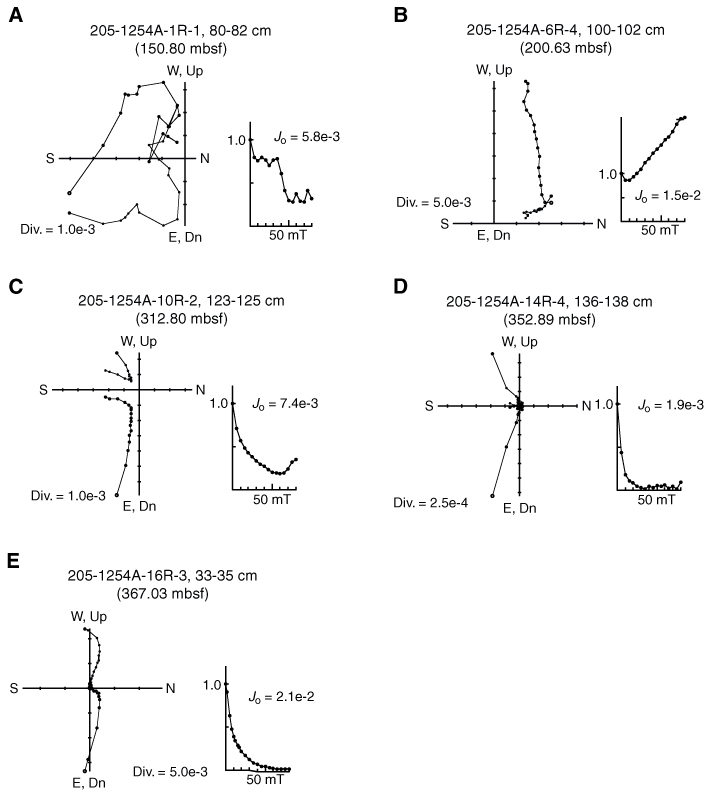
Figure F40. Zijderveld diagrams and demagnetization plots for discrete samples obtained from several intervals in Hole 1254A. A. Sediment from above the high-intensity anomaly at ~180 mbsf. B, C. Samples obtained from the sediment corresponding to the first and second anomalies (see "Demagnetization Analyses of Discrete Samples" in "Paleomagnetism") of the magnetic intensity. D. Sample showing low magnetic intensity ratio below the lower anomaly of the magnetic intensity. E. Sample from lithostratigraphic Subunit U1A.