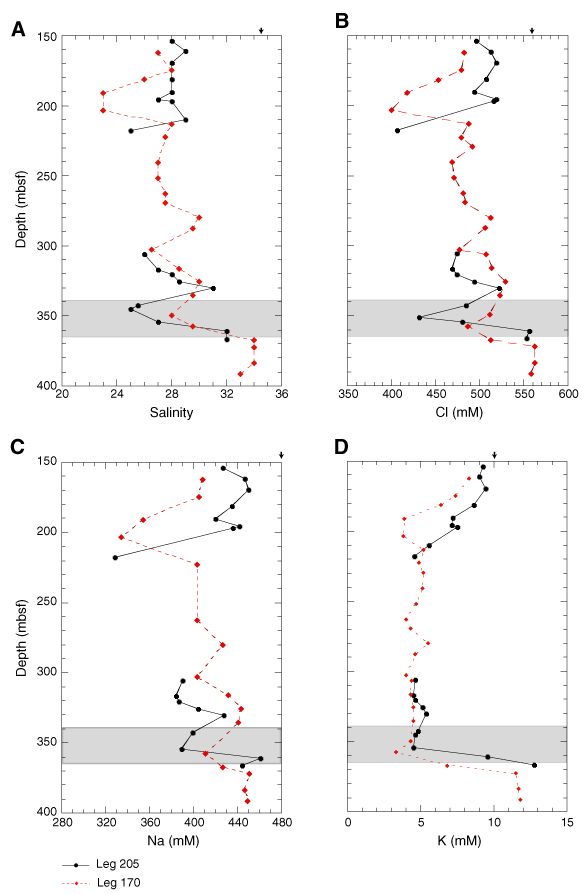
Figure F41. Depth profiles of (A) salinity, (B) Cl, (C) Na, and (D) K. Arrows = seawater concentration. Shaded area = the décollement at Site 1254. Error bars are smaller than or comparable to symbol size (see "Inorganic Geochemistry" in the "Explanatory Notes" chapter).