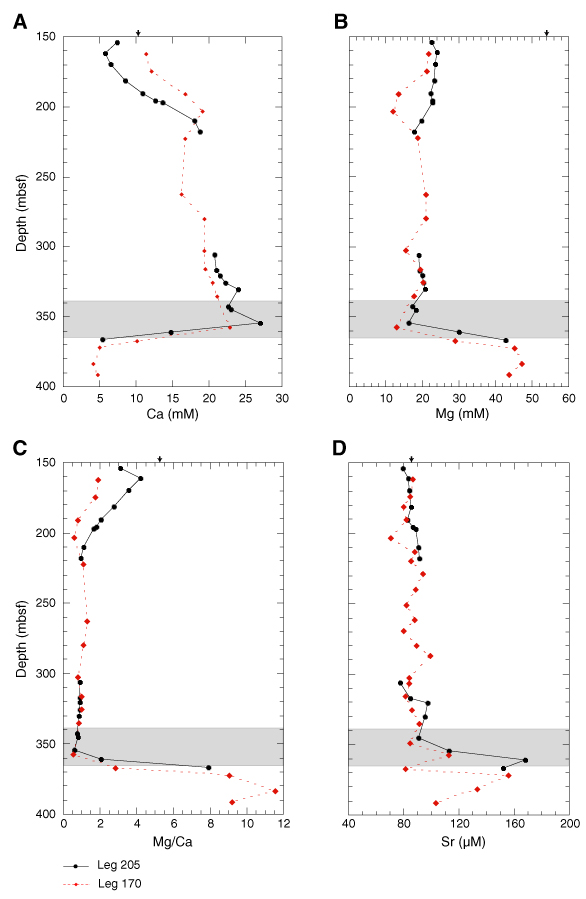
Figure F42. Depth profiles of (A) Ca, (B) Mg, (C) Mg/Ca, and (D) Sr. Arrows = seawater concentration. Shaded area =the décollement at Site 1254. Error bars are smaller than or comparable to symbol size (see "Inorganic Geochemistry" in the "Explanatory Notes" chapter). Leg 170 Sr data are provided by M. Kastner (pers. comm., 2002).