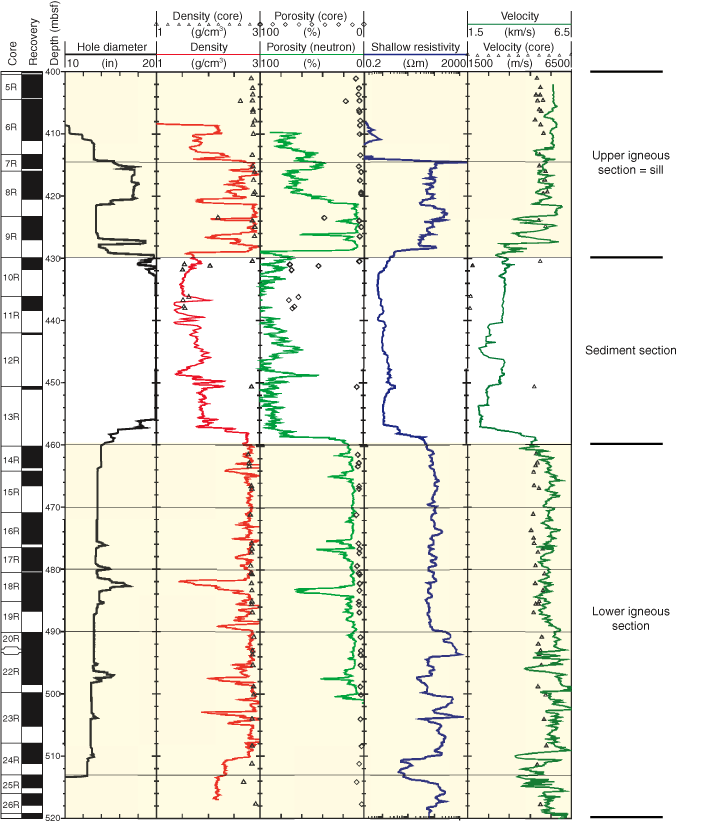
Figure F2. Compilation of logging data and physical property measurements at Site 1253 (Shipboard Scientific Party, 2003b). From left to right: core recovery, hole diameter (logged = black line), density (core = diamonds, logged = red line), porosity (core = diamonds, logged = green line), resistivity (logged = blue line) and compressional wave velocity (core = diamonds, logged = green line). The two igneous units (yellow shading) can be distinguished in all parameters from the intermittent sediment section. The lower igneous unit comprises several subunits, indicating different stages of alteration and an increase in fractures abundance at a depth below 513 mbsf. OsmoSamplers were installed at 500 and 515 mbsf.


![]()