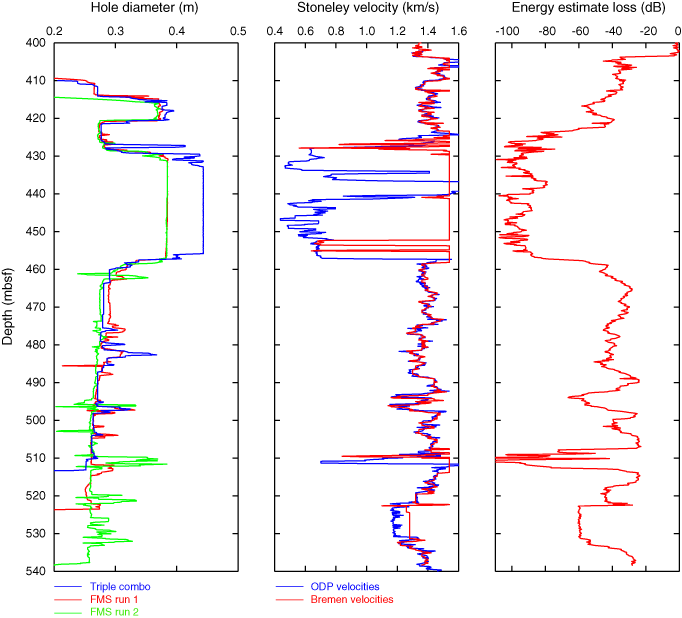
Figure F7. Borehole diameter measurements (left), picked Stoneley wave velocity, and estimate of Stoneley energy (right). Green line = Stoneley velocity approximated for low frequencies. In the igneous section, ODP-picked Stoneley velocities agree very well with ours, indicating a reliably working algorithm. Energy of the Stoneley wave is given in relation to maximum energy measured along the profile (at 405 mbsf) and indicated as energy loss in decibels. FMS = Formation MicroScanner.


![]()