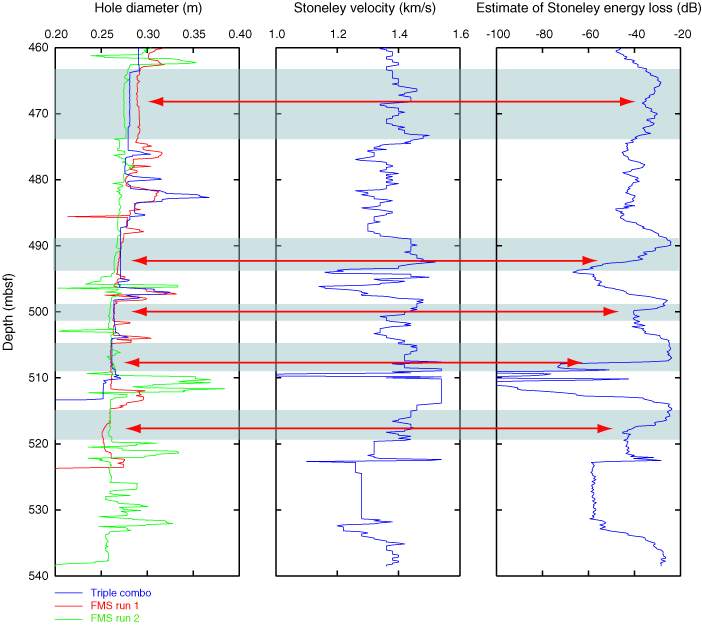
Figure F8. Borehole diameter measurements (left), picked Stoneley wave velocity, and estimate of Stoneley energy (right) in detail. Borehole diameter as determined from the triple combo and FMS tools. Light blue = regions of smooth borehole walls, red arrows = locations of energy losses despite the smooth wall. We compare our results to other measurements that might indicate fracture density, such as fracture observations on cores and geochemical investigations of pore water. Velocity changes are disregarded because data at ~510 mbsf are erroneous and we assume the energy estimate, determined independently from velocity, not to be influenced. FMS = Formation MicroScanner.


![]()