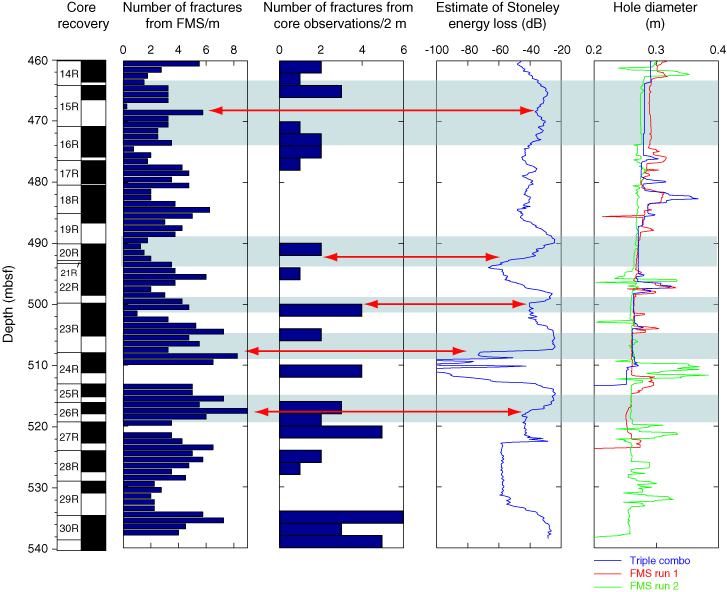
Figure F9. Compilation of core recovery, number of fractures counted on FMS, number of fractures counted on recovered core material, estimate of Stoneley energy and borehole diameter. Light blue = regions of smooth borehole wall, red arrows = energy losses despite the smooth wall. FMS did not deliver reliable data from 510 to 514 mbsf. FMS = Formation MicroScanner.


![]()