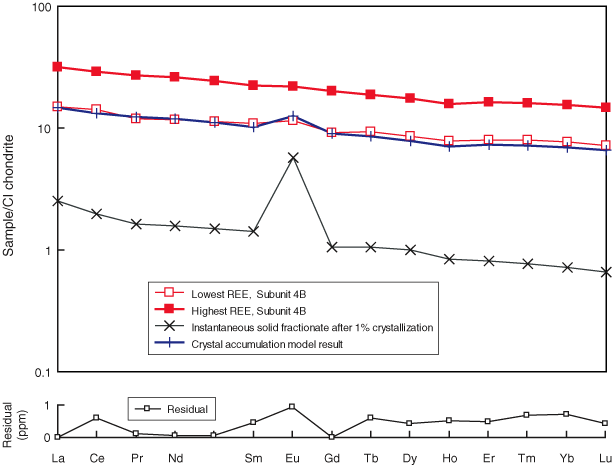
Figure F12. Crystal accumulation model for the rare earth element (REE) range observed in Subunit 4B. In this model an instantaneous solid crystallized from the most enriched Subunit 4B sample is incrementally added to the most enriched sample composition for Subunit 4B until a match is found for the least enriched composition of Subunit 4B. The composition of the instantaneous solid is constrained by the modal abundances observed in Leg 170 samples (Kimura, Silver, Blum, et al., 1997) and the partition coefficient data of McKenzie and O'Nions (1991) (olivine, orthopyroxene, clinopyroxene, and plagioclase) and Agee (1990) (magnetite). We assume that the instantaneous solid is a product of fractional crystallization from liquids with the composition of the more enriched samples from Subunit 4B. Mineral compositional data are required to confirm this assumption; therefore, more quantitative modeling is deferred. The difference between the lowest REE abundance sample in Subunit 4B and the model result is also shown. As modeled, crystal accumulation does not appreciably alter the slope of the REE and reproduces the slight positive Eu anomaly observed in the lowest abundance samples from Subunit 4B. Note that the highest REE abundance within Subunit 4B occurs from Leg 170, but this model uses the highest Subunit 4B sample from Leg 205 to avoid potential laboratory bias and because of the generally improved precision of ICP-MS analyses. Normalization values are from Lodders and Fegley, 1998.


![]()