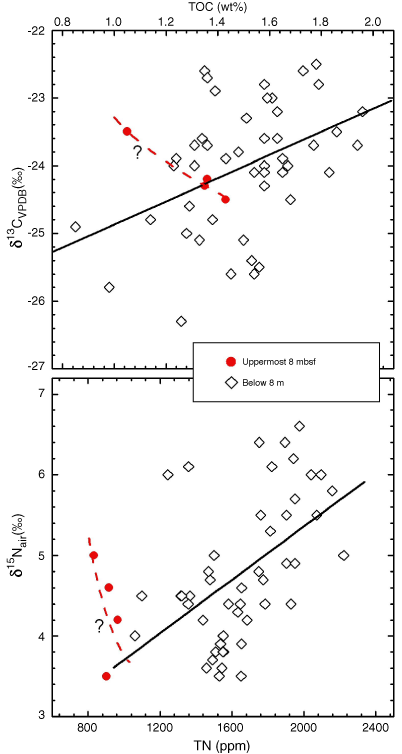
Figure F5. Plot of concentration vs. isotope composition of total organic carbon (TOC) and total nitrogen (TN) of sediments from Site 1040. The data are divided factitiously into two groups: uppermost 8 mbsf and below 8 mbsf. Data for samples below 8 mbsf show a crude negative relationship between concentrations and isotope compositions. Data for samples in the uppermost 8 mbsf show a weak positive linear correlation of concentrations and isotope compositions. VPDB = Vienna Peedee belemnite.


![]()