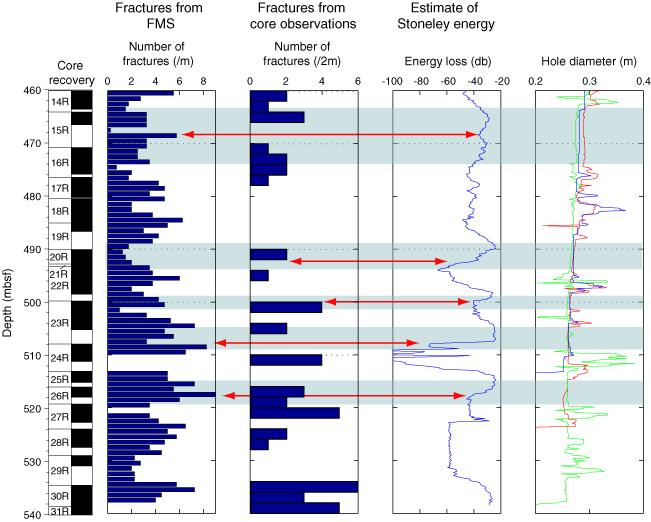
Figure F11. Composite diagram showing fracture distribution based on Formation MicroScanner (FMS) data and core observations, along with estimates of Stoneley energy and borehole diameter (from Pfender and Villinger, this volume). OsmoSamplers (OS) 1 and 2 were located at 497–504 mbsf and 512–519 mbsf, respectively.


![]()