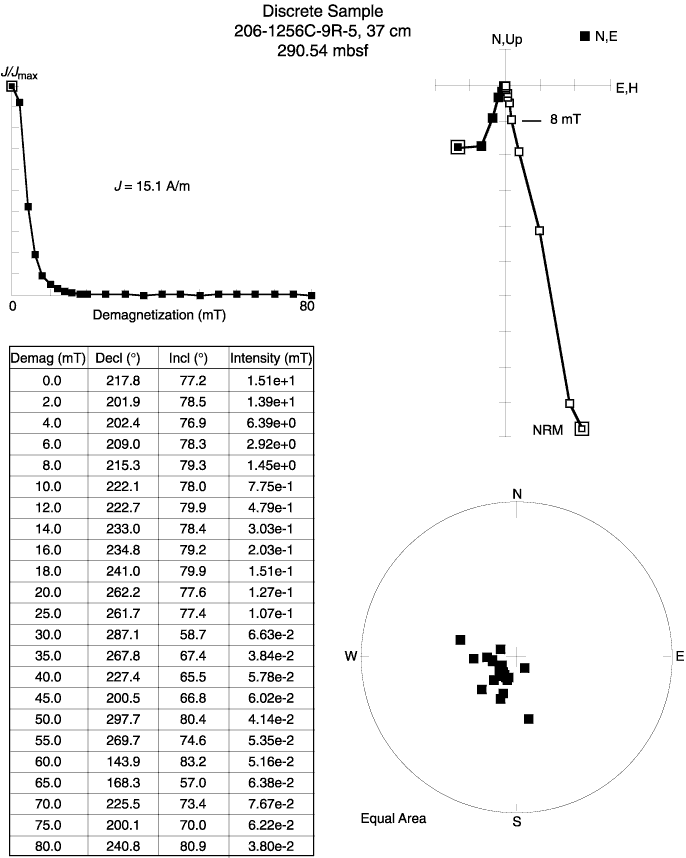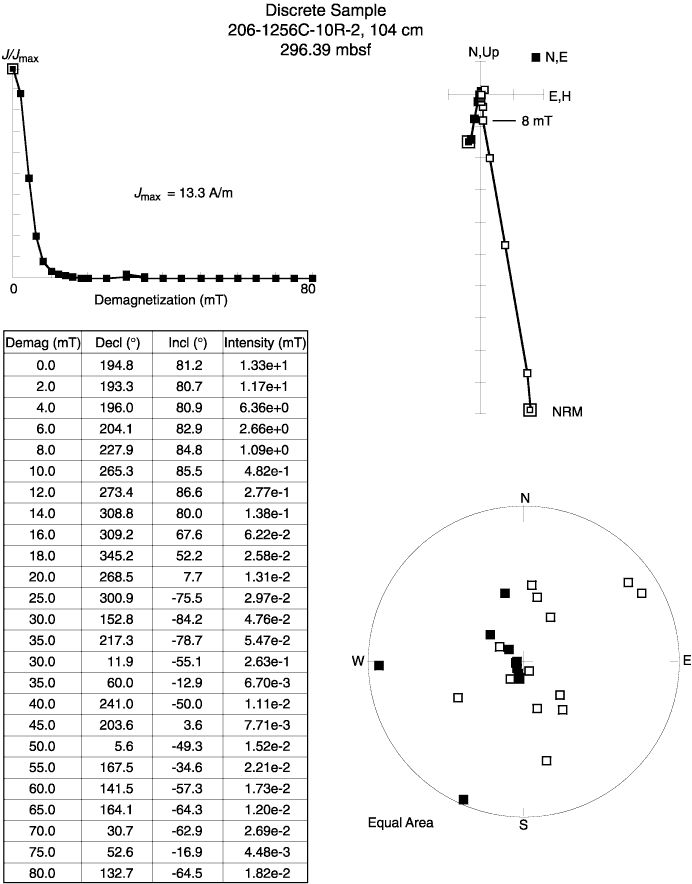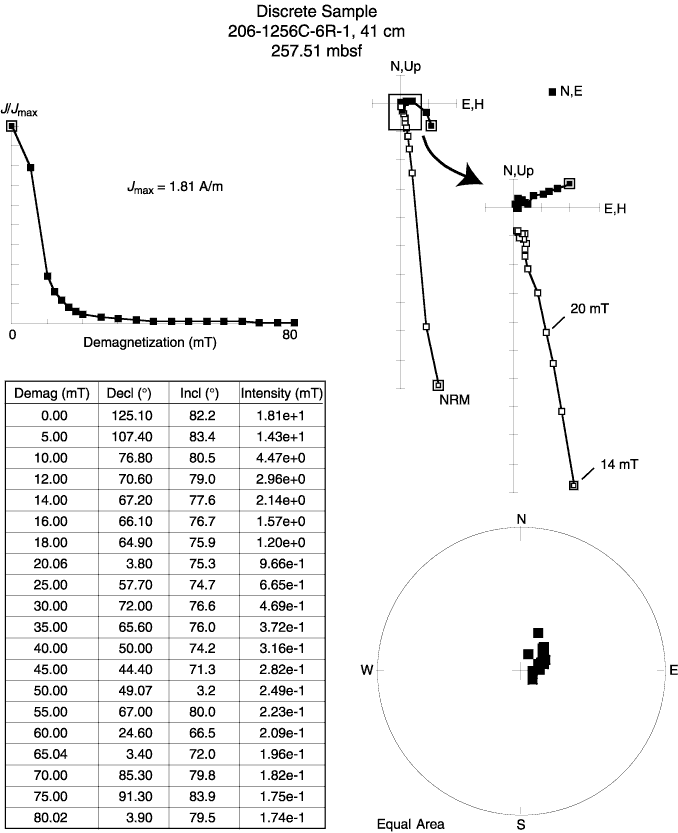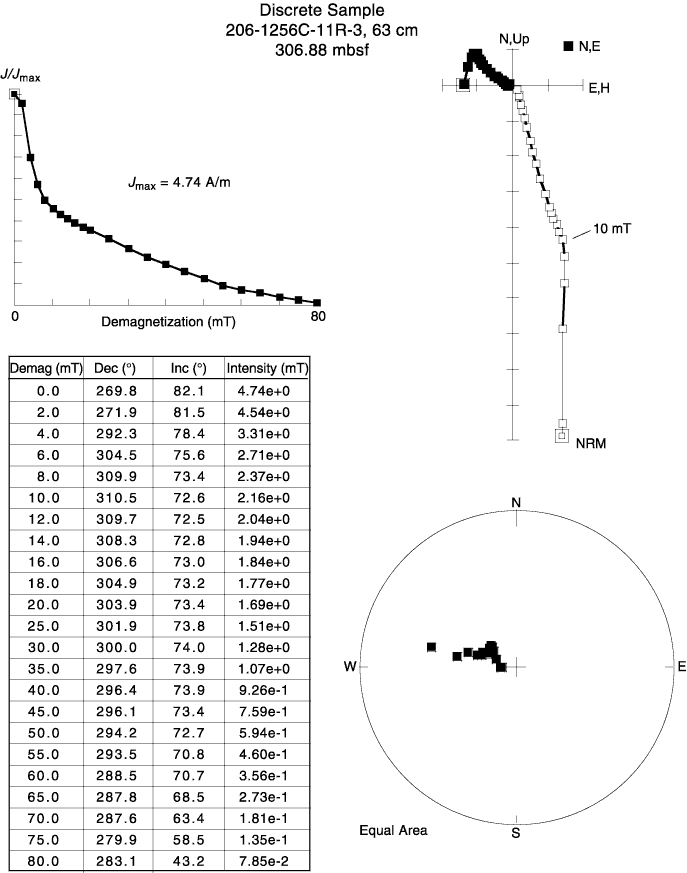
Figure F166. AF demagnetization plots. A. A typical sample from Hole 1256C. Coercivities are low, but directions remain moderately coherent at high demagnetization levels. Component plot at upper right shows north and east horizontal components as solid symbols and total horizontal and vertical components as open symbols. B. Coercivities are extremely low and directions become incoherent at moderate demagnetization levels. Component plot at upper right shows north and east horizontal components as solid symbols and total horizontal and vertical components as open symbols. C. Directions are quite stable, and coercivity is higher than most samples from Hole 1256C. Component plot at upper right shows north and east horizontal components as solid symbols and total horizontal and vertical components as open symbols. D. This exceptionally stable sample appears to have the drilling overprint removed by 14 mT. Component plot at upper right shows north and east horizontal components as solid symbols and total horizontal and vertical components as open symbols.


![]()