
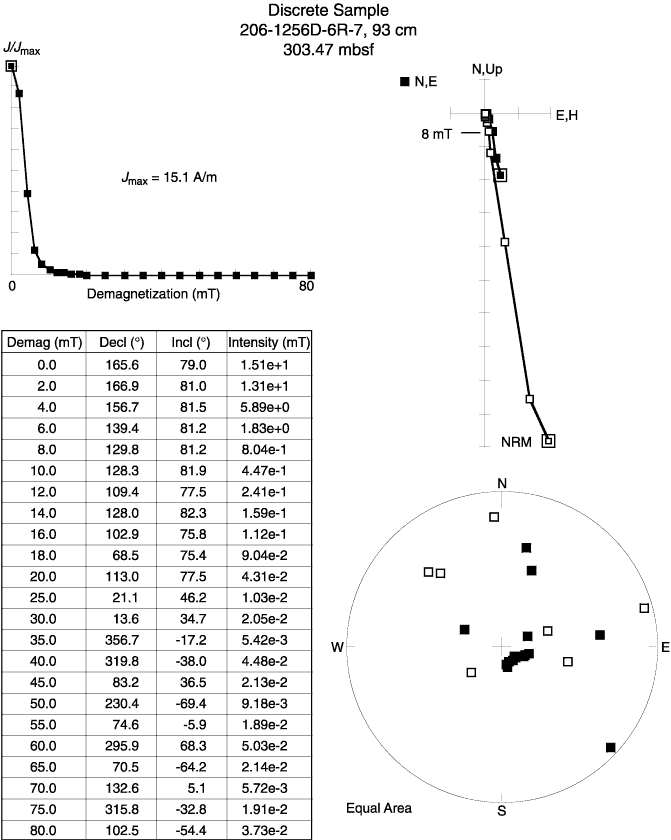
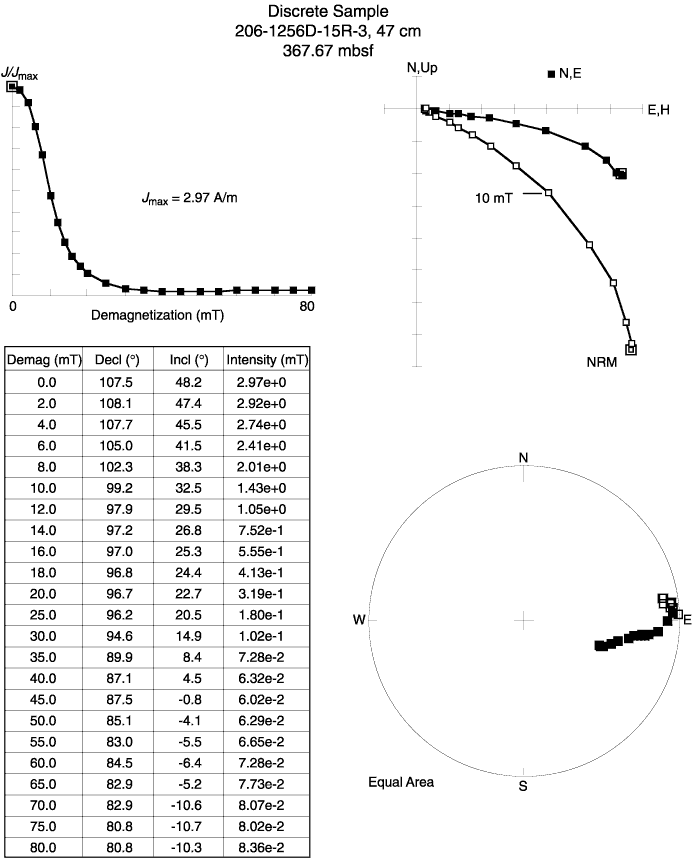
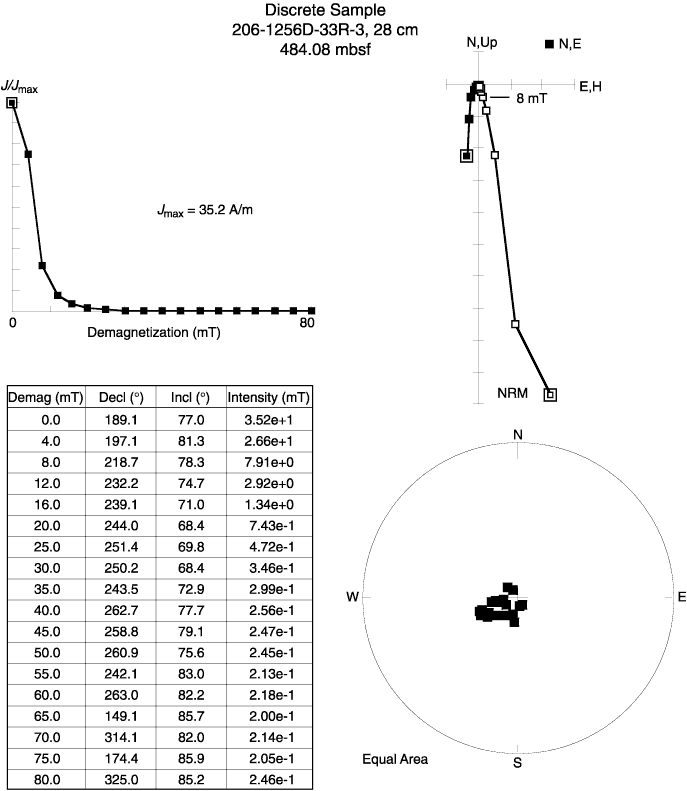
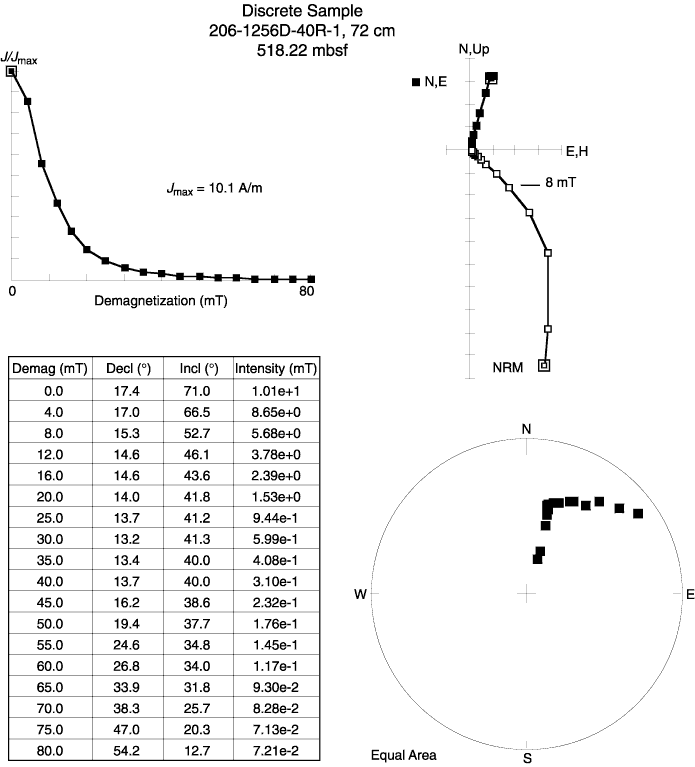
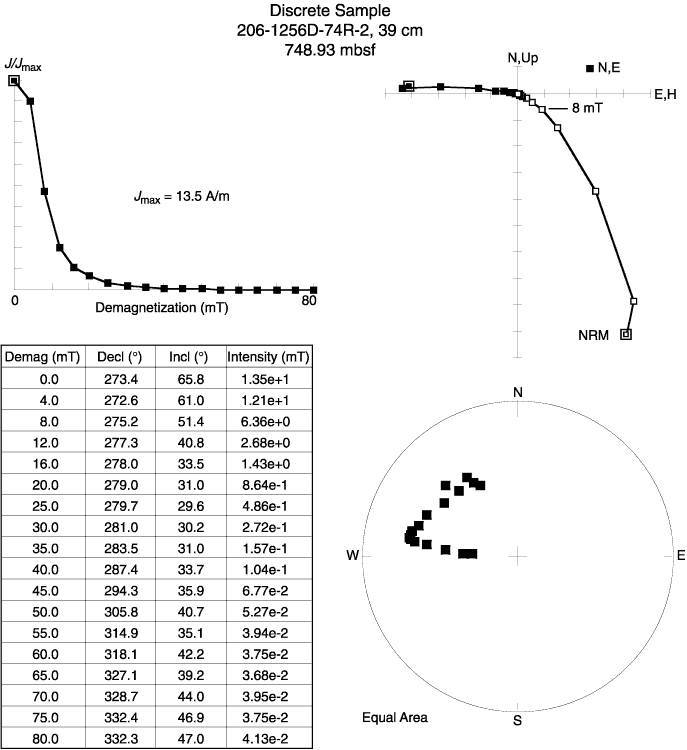
Figure F167. AF demagnetization plots. A. An extremely low coercivity sample typical of igneous Subunits 1256D-1b and 1256D-1c. Component plot at upper right shows north and east horizontal components as solid symbols and total horizontal and vertical components as open symbols. B. A relatively high coercivity sample with a shallow stable inclination. Component plot at upper right shows north and east horizontal components as solid symbols and total horizontal and vertical components as open symbols. C. A low coercivity sample dominated by drilling overprint. Component plot at upper right shows north and east horizontal components as solid symbols and total horizontal and vertical components as open symbols. D. Intermediate demagnetizations show a ~40° inclination that we interpret as primary, and higher demagnetizations show a shallower direction that we interpret as ARM. Component plot at upper right shows north and east horizontal components as solid symbols and total horizontal and vertical components as open symbols. E. This moderate coercivity sample shows drilling overprint, probable primary shallow inclination, and probable ARM components imparted by the AF demagnetization unit, but without clear separation of the components over successive demagnetization steps. Component plot at upper right shows north and east horizontal components as solid symbols and total horizontal and vertical components as open symbols.


![]()