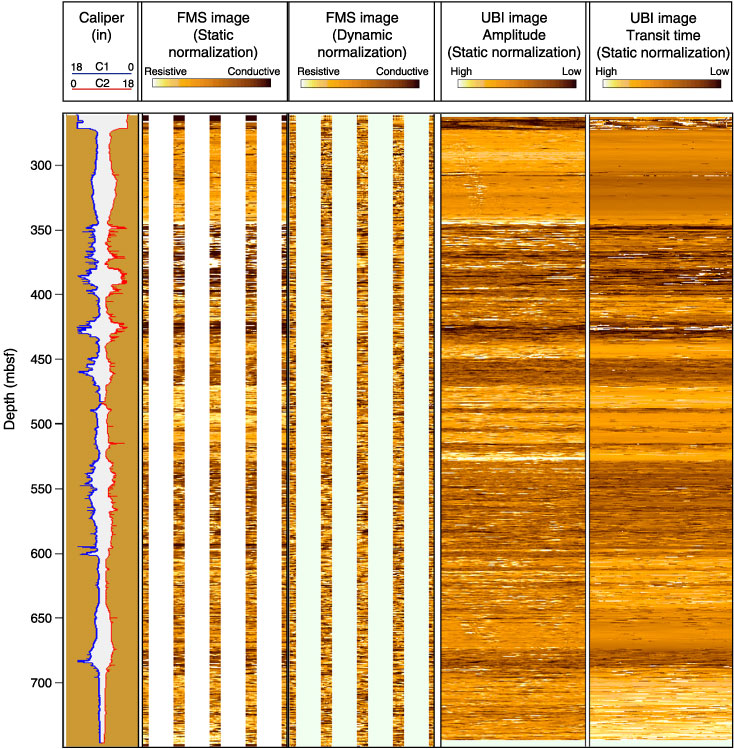
Figure F192. Comparison of Formation MicroScanner (FMS) images (static and dynamic normalization) and Ultrasonic Borehole Imager (UBI) images (static normalization of the amplitude and transit time). These different normalizations differ by the computation window size for the color attribution to a selected microresistivity (or amplitude) value. For the static normalization, a single computation is carried out in a window covering the entire section, and for the dynamic normalization separate computations are repeated at regularly spaced intervals using a sliding window of relatively short length. Both FMS and UBI are presented straight (i.e., the images are not oriented). The borehole shape, measured by the FMS caliper is presented in the first column.