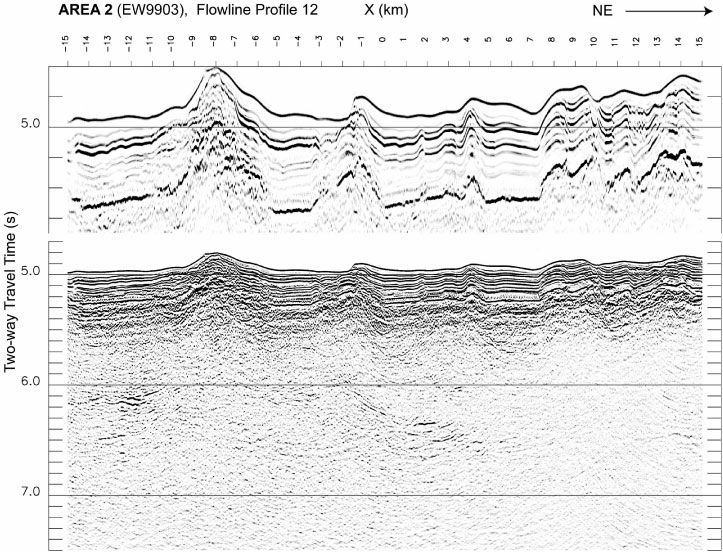
Figure F21. Migrated MCS section for line 12, grid 2. See Figure F16 for location. The upper panel shows part of the same data as the lower panel but plotted at lower gain and greater vertical exaggeration to show detail in the sedimentary section. Distances are measured northeast of the line 16 crossing.