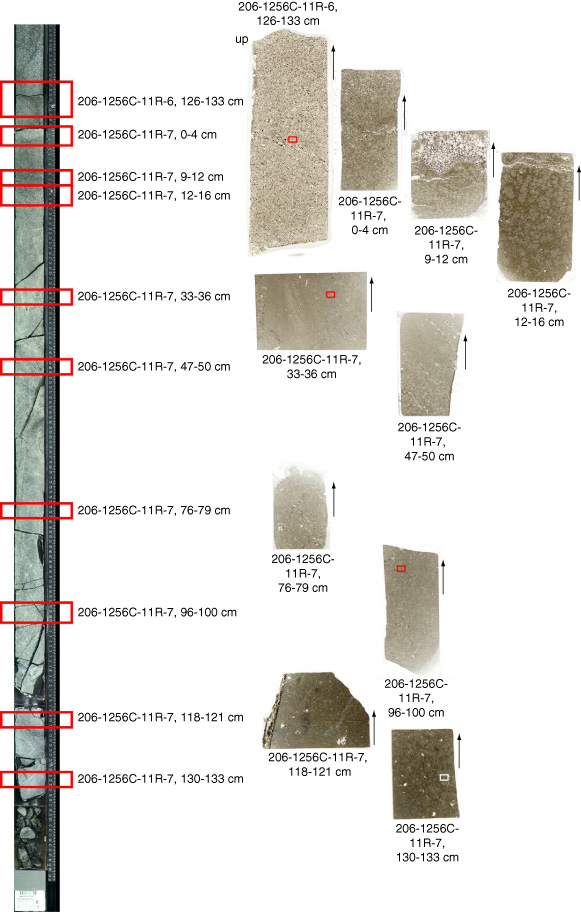
Figure F3. Core image of the recrystallized base of Unit 1256C-18 with sample locations for thin sections (rectangles on the core image) showing textural variations. Photomicrographs of selected samples are shown in Figure F4, of which positions are shown by small rectangles on the thin section images.