Figure F7.
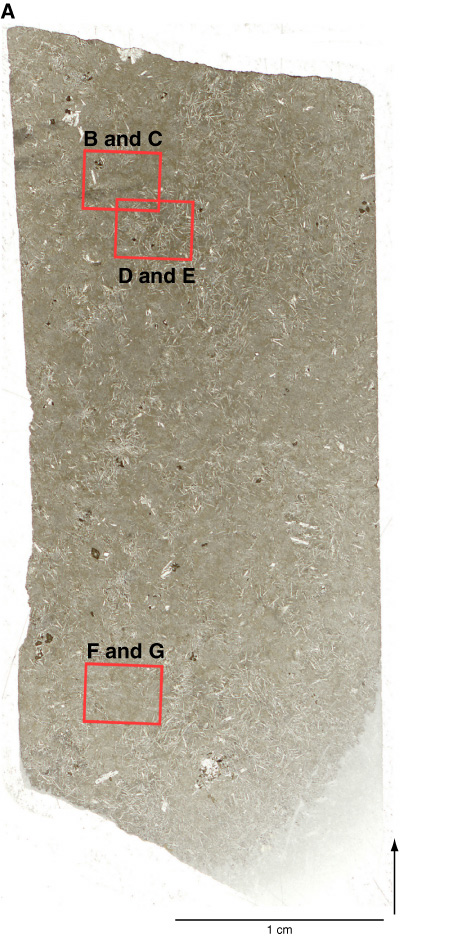
SEM images of Sample 206-1256C-11R-7, 96–100 cm.
A.
Photomicrograph of a thin section showing locations of (
B–G
) SEM images. (Continued on next page.)