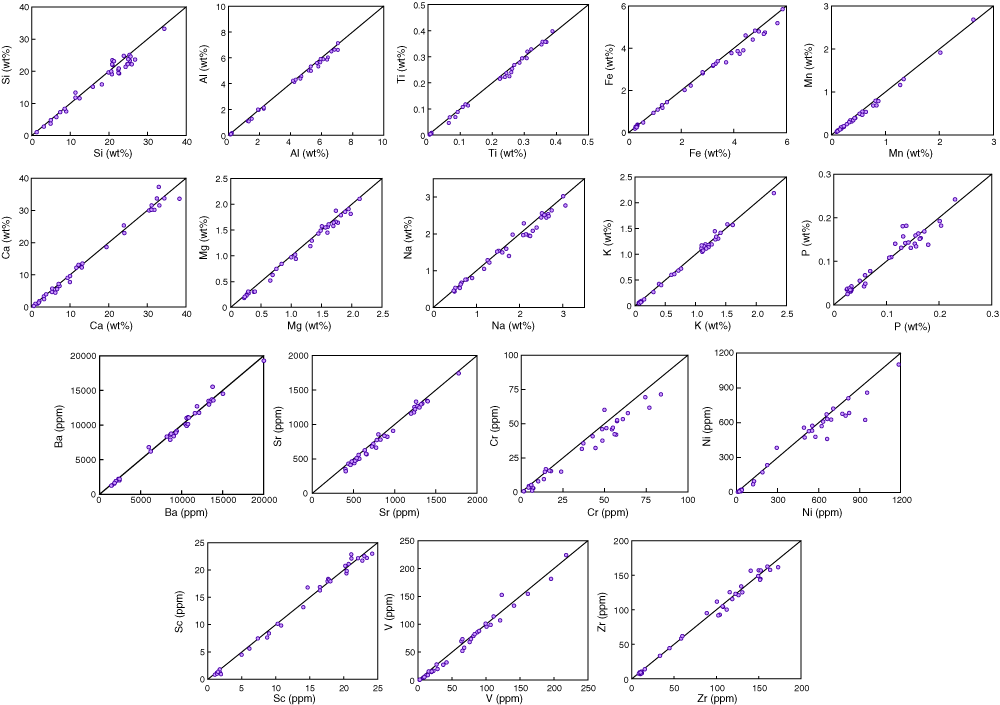
Figure F2. Comparison of concentrations between flux and microwave-assisted acid digestions at Boston University. The solid diagonal line is a 1:1 line, not a linear regression of the data. X-axis = microwave-assisted acid digestions, y-axis = flux fusion digestions.


![]()