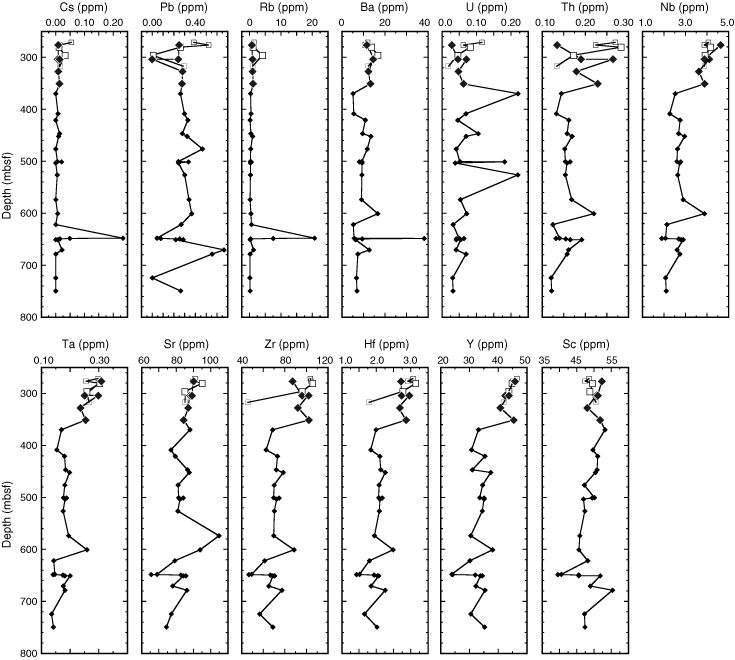
Figure F1. Plots of trace element abundance vs. depth for samples analyzed. Open symbols = samples from Hole 1256C, solid diamonds = samples from Hole 1256D. Samples of the massive ponded flow (Unit 1256C-22 and Unit 1256D-1) are shown with larger symbols. Data for the chert from Hole 1256C (Sample 206-1256C-4R-1, 13–20 cm) are not plotted in order to emphasize differences between samples of the igneous basement.


![]()