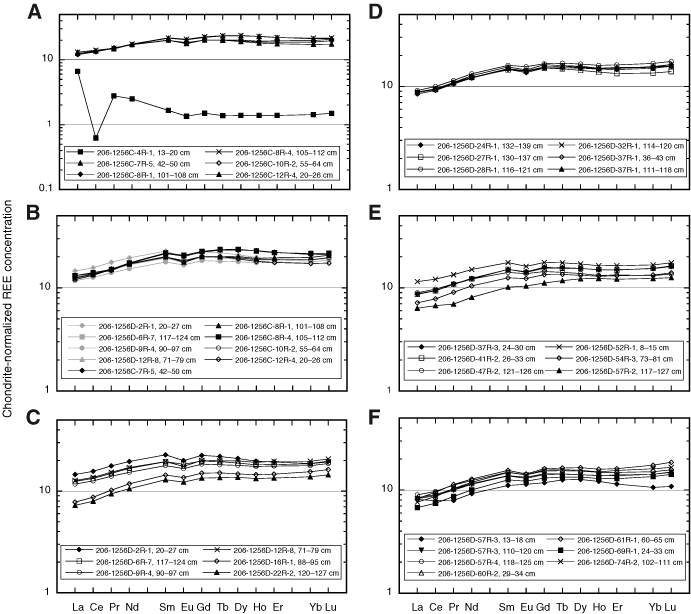
Figure F3. Diagrams showing rare earth element (REE) abundances normalized to chondritic values (Nakamura, 1974). A. All samples from Hole 1256C. B. Samples of the igneous basement in Hole 1256C (black lines and symbols), with data for the massive ponded flow in Hole 1256D shown in gray for comparison. C–F. Samples of igneous basement in Hole 1256D. Samples of massive ponded flow in Hole 1256D are also shown in C. Data are plotted on four diagrams in order to allow easier discrimination between samples.


![]()