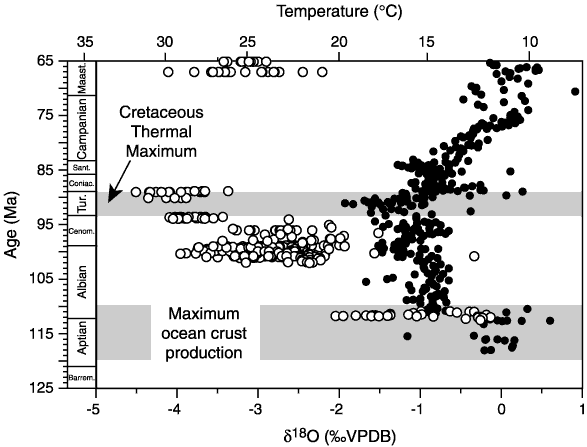
Figure F6. Comparison of Cretaceous  18O temperature records indicate a 20- to 40-m.y. mismatch between peak Cretaceous–Cenozoic warmth and peak Cretaceous–Cenozoic tectonic CO2 production inferred from ocean crust cycling (after Wilson et al., 2002). Open symbols = "glassy" foraminifers from the low-latitude western Atlantic, Gulf Coast, and Tanzania. Solid symbols = bulk carbonate from the high-latitude southern Indian Ocean. All temperatures are conservative values calculated assuming
  w = mean Cretaceous seawater and would be 3°–6°C higher if modern latitudinal trends in
  w were applied. VPDB = Vienna Peedee belemnite.


 18O temperature records indicate a 20- to 40-m.y. mismatch between peak Cretaceous–Cenozoic warmth and peak Cretaceous–Cenozoic tectonic CO2 production inferred from ocean crust cycling (after Wilson et al., 2002). Open symbols = "glassy" foraminifers from the low-latitude western Atlantic, Gulf Coast, and Tanzania. Solid symbols = bulk carbonate from the high-latitude southern Indian Ocean. All temperatures are conservative values calculated assuming
  w = mean Cretaceous seawater and would be 3°–6°C higher if modern latitudinal trends in
  w were applied. VPDB = Vienna Peedee belemnite.