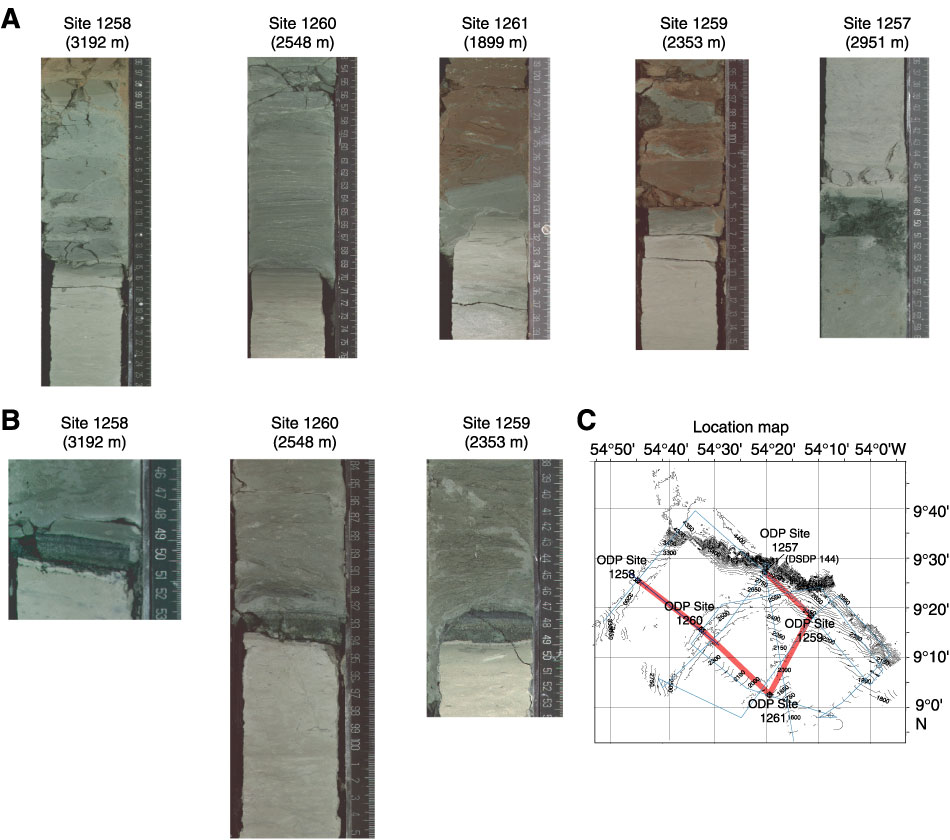
Figure F9. Close-up photographs of the P/E and K/T boundary intervals recovered during Leg 207. Each section is in meters above and below the boundary intervals. A. The P/E boundary interval is hung on the clay layer interpreted as the lithologic expression of shoaling of the CCD associated with the benthic extinction event and carbon isotope excursion. B. The K/T boundary interval is hung on the base of the spherule layer interpreted as a primary air fall deposit of material ejected by the K/T impact. C. Locality map of the Leg 207 sites on Demerara Rise. The water depth for each site is indicated.