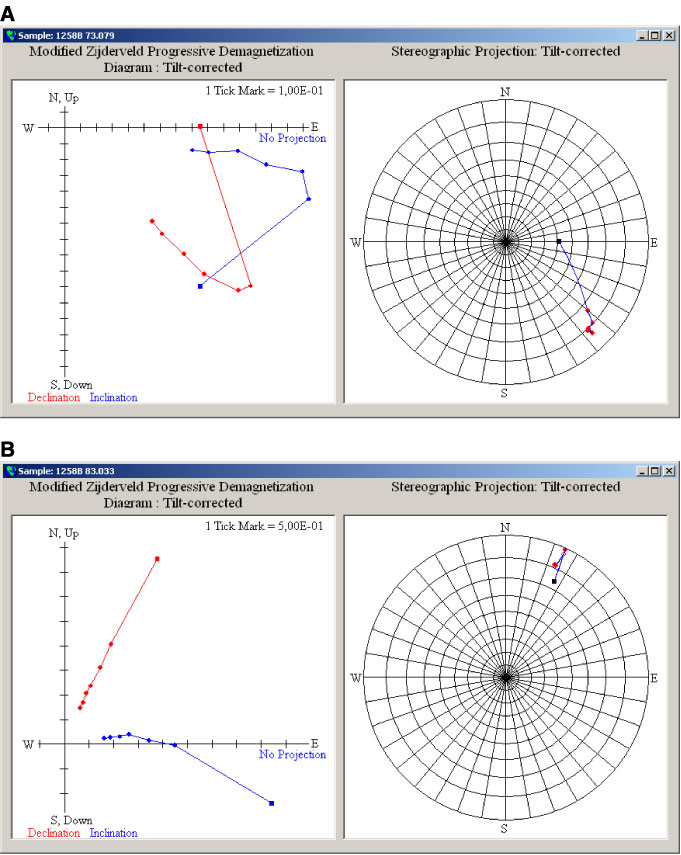
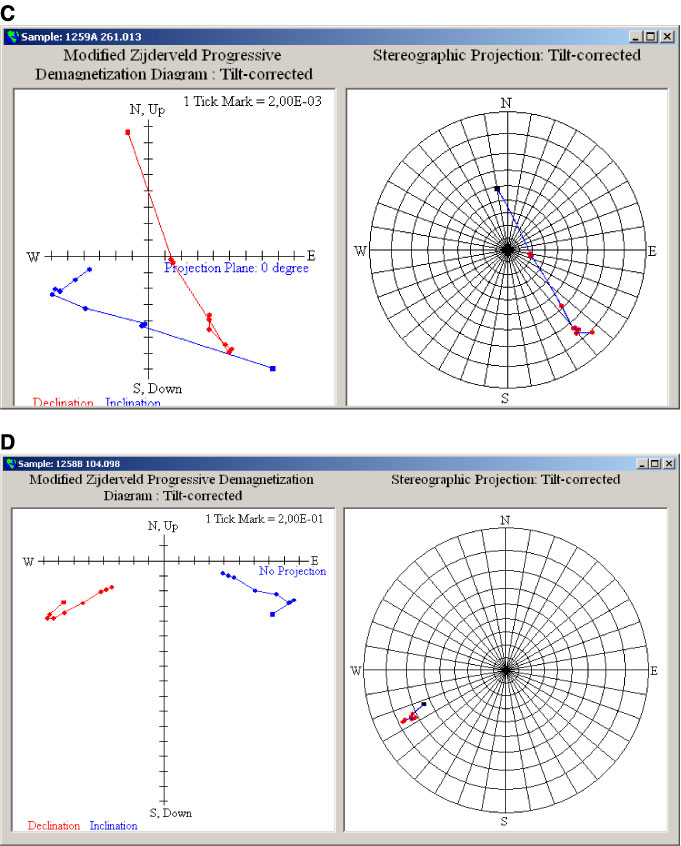
Figure F7. Selected vector plots and stereo diagrams of thermal demagnetization behavior of Eocene chalk samples. Plots are screen images from PALEOMAG software (www.eas.purdue.edu/paleomag/). In the vector plots, the declination and inclination components (red and blue curves, respectively) of the magnetization vector correspond to the horizontal component and to the actual dip of the magnetization vector; scale divisions are in mA/m, unless otherwise noted. Demagnetization procedures are NRM (square point at end), 5 mT AF, 150°C, then progressive 50° steps to 400°C or 450°C. The characteristic directions from Eocene sediments recovered during Leg 207 generally have negative inclinations associated with normal polarity behaviors and positive inclinations with reversed polarity. A. Example of a typical "hook-type" curve that is interpreted as unblocking of a downward normal polarity overprint from a positive inclination reversed polarity characteristic direction. Magnetic intensity increases immediately after an initial shift in declination accompanying an inclination shallowing. Sample 209-1258B-7R-3, 79 cm (early Eocene nannofossil chalk) has a characteristic magnetization (136.6° declination, 9.3° inclination, mean intensity = 1.0E+0 mA/m) derived from the last four steps (250°–400°C and tied to origin) and assigned an "R" polarity rating based on the univectorial decay. B. Example of a typical "N-type" curve that is interpreted as unblocking of a positive inclination normal polarity overprint from a negative inclination normal polarity characteristic direction. Sample 209-1258B-8R-3, 33 cm (early Eocene nannofossil chalk), has a characteristic magnetization (23.6° declination, –8.3° inclination, mean intensity = 1.0E+0 mA/m) derived from the last four steps (250°–400°C, tied to origin) and assigned an "N" polarity rating based on the univectorial decay. C. Example of an "R-type" curve. Declination progressively rotates as the vector initially decreases in intensity, then increases in intensity with a declination nearly opposite to the initial NRM. Further thermal demagnetization is univectorial decay. In contrast to the other plots, the inclination components have been projected onto a constant north–south plane to clearly illustrate the rotational behavior. Sample 209-1259A-26R-1, 13 cm (middle Eocene nannofossil chalk) has a characteristic magnetization (138.8° declination, 15.1° inclination, mean intensity = 1.4E–2 mA/m) derived from the last five steps (200°–400°C, tied to origin) and assigned an "R" polarity rating based on the univectorial decay. D. Example of a subtle "hook-type" curve. Stable declination would appear to suggest a normal polarity sample, but the early demagnetization steps caused an increase in magnetic intensity during shallowing of the inclination. This initial increase in intensity implies that a vector of opposite declination is being removed, which is interpreted as the normal polarity overprint on a reversed polarity characteristic direction. Sample 209-1258B-10R-4, 98 cm (early Eocene nannofossil chalk), has a characteristic magnetization (243.0° declination, 15.5° inclination, mean intensity = 1.1E+0 mA/m) derived from the last five steps (250°–450°C, tied to origin) and assigned an "R" polarity rating based on the univectorial decay.