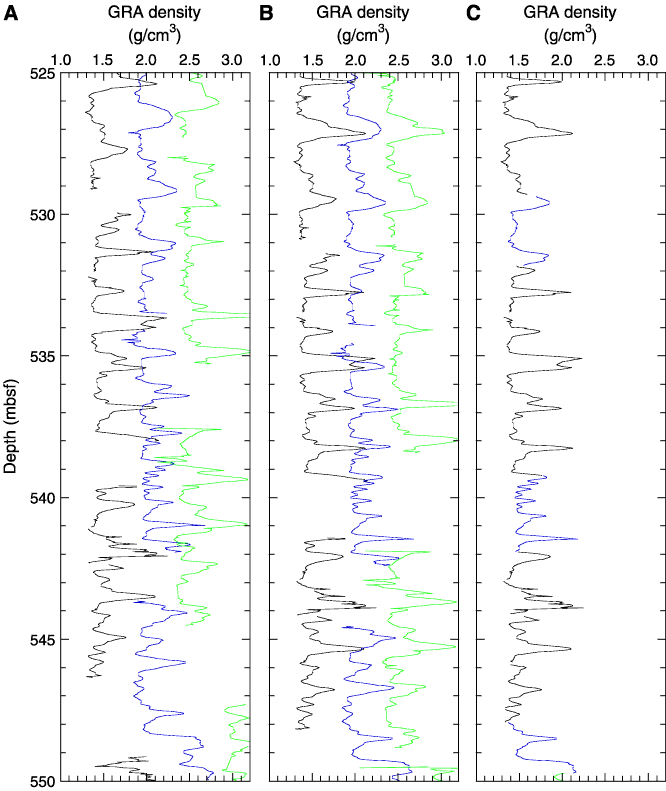
Figure F8. A. Gamma ray attenuation (GRA) density data for a portion of Holes 1259A (black), 1259B (blue), and 1259C (green) plotted vs. mbsf depth. B. GRA density data for a portion of Holes 1259A (black), 1259B (blue), and 1259C (green) plotted vs. mcd depth. C. Splice record of GRA density from 525 to 550 mcd at Site 1259, showing cores from Holes 1259A (black) and 1259B (blue) that were patched together.


![]()