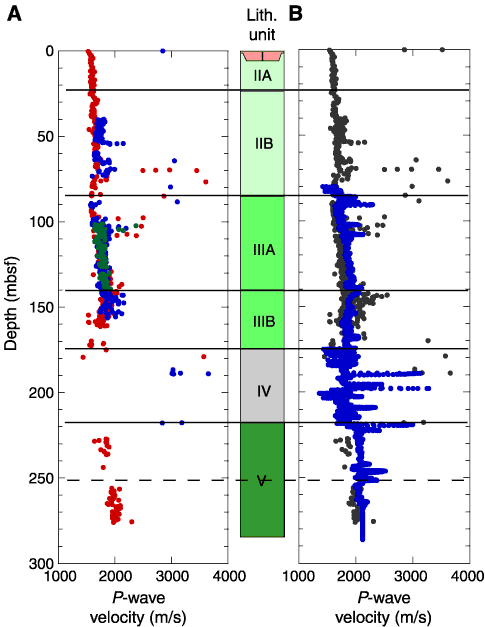
Figure F20. A. P-wave velocity measurements from split cores at Site 1257. Red = Hole 1257A, blue = Hole 1257B, green = Hole 1257C. B. Combined split-core velocity measurements (black) (corrected for in situ temperature and pressure) overlain with logging velocities (blue).


![]()