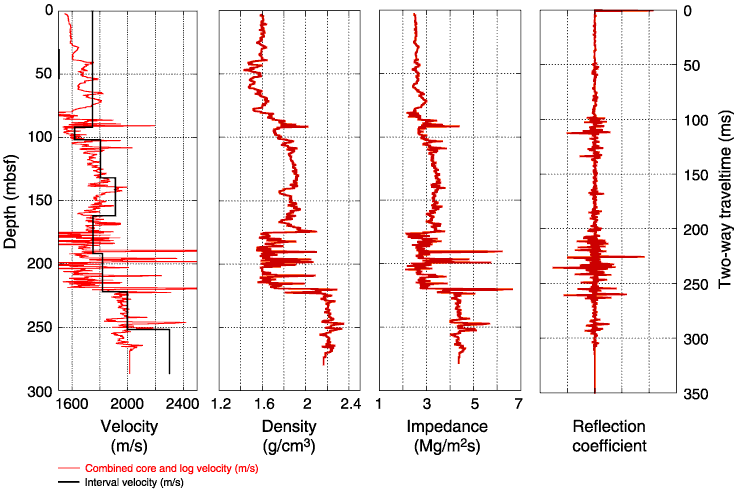
Figure F32. Formation density, velocity, impedance, and reflection coefficient series profiles obtained from downhole logging and core physical property measurements from Hole 1257A. The solid black line on the velocity curve represents interval velocities calculated from the checkshot survey. The logging velocities were shifted by –100 m/s to match the checkshot and laboratory-measured velocity values.


![]()