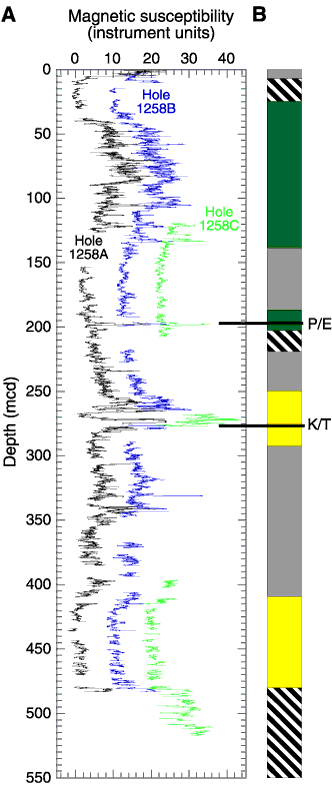
Figure F15. Magnetic susceptibility data vs. composite depth plotted along with a qualitative estimate of the confidence of the core-to-core correlations among holes at Site 1258. A. Data from Holes 1257A (black), 1258B (blue), and 1258C (green). The composite data from Holes 1258B and 1258C are offset by a constant (10 and 20 units, respectively) for illustration purposes. B. Green indicates intervals with definitive hole-to-hole correlations and good depth control resulting from core gaps being spanned. Yellow indicates intervals were good core-to-core correlations could be made (i.e., a one-to-one match of signals between holes) but definitive depth positions could not be established because coring gaps could not be spanned. Gray indicates intervals where correlations were made using similarities in trends of MST signals. The diagonal line pattern indicates intervals where hole-to-hole correlations could not be made (primarily the result of only one hole or core in that interval). P/E = Paleocene/Eocene boundary, K/T = Cretaceous/Tertiary boundary.


![]()