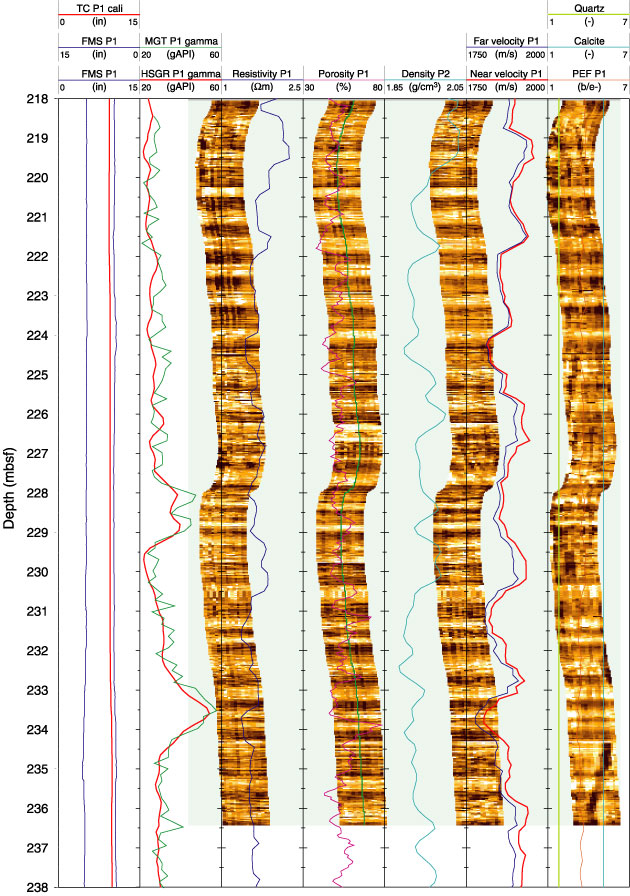
Figure F30. Correlation of wireline physical property variations with Formation MicroScanner (FMS) imagery from an interval through logging Subunit 2a from Hole 1258C. These data show cyclic variability. TC = triple combination, MGT = Multi-Sensor Spectral Gamma Ray tool, HSGR = HNGS Standard (total) Gamma Ray, PEF = photoelectric effect.