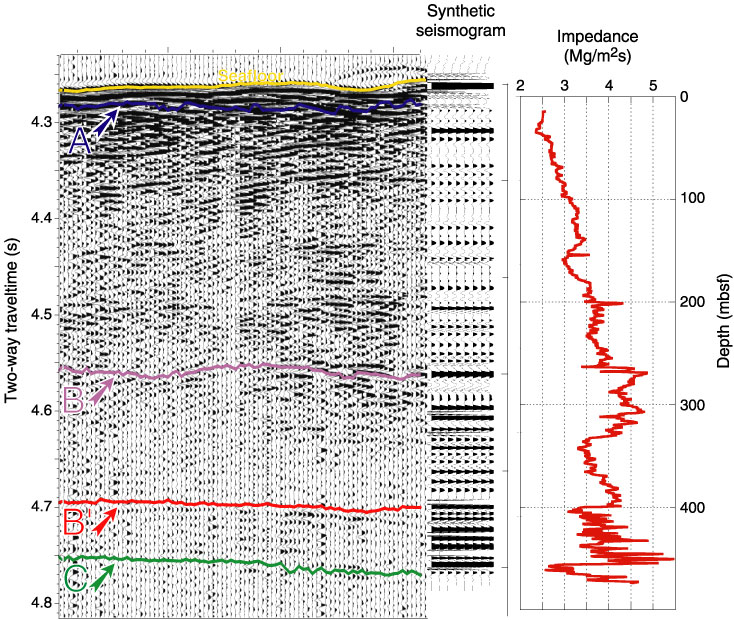
Figure F35.
Part of seismic line GeoB221, the calculated synthetic seismogram (plotted at the Hole 1258C position on the seismic line), and the associated impedance profile (from which the synthetic was derived) plotted in mbsf.