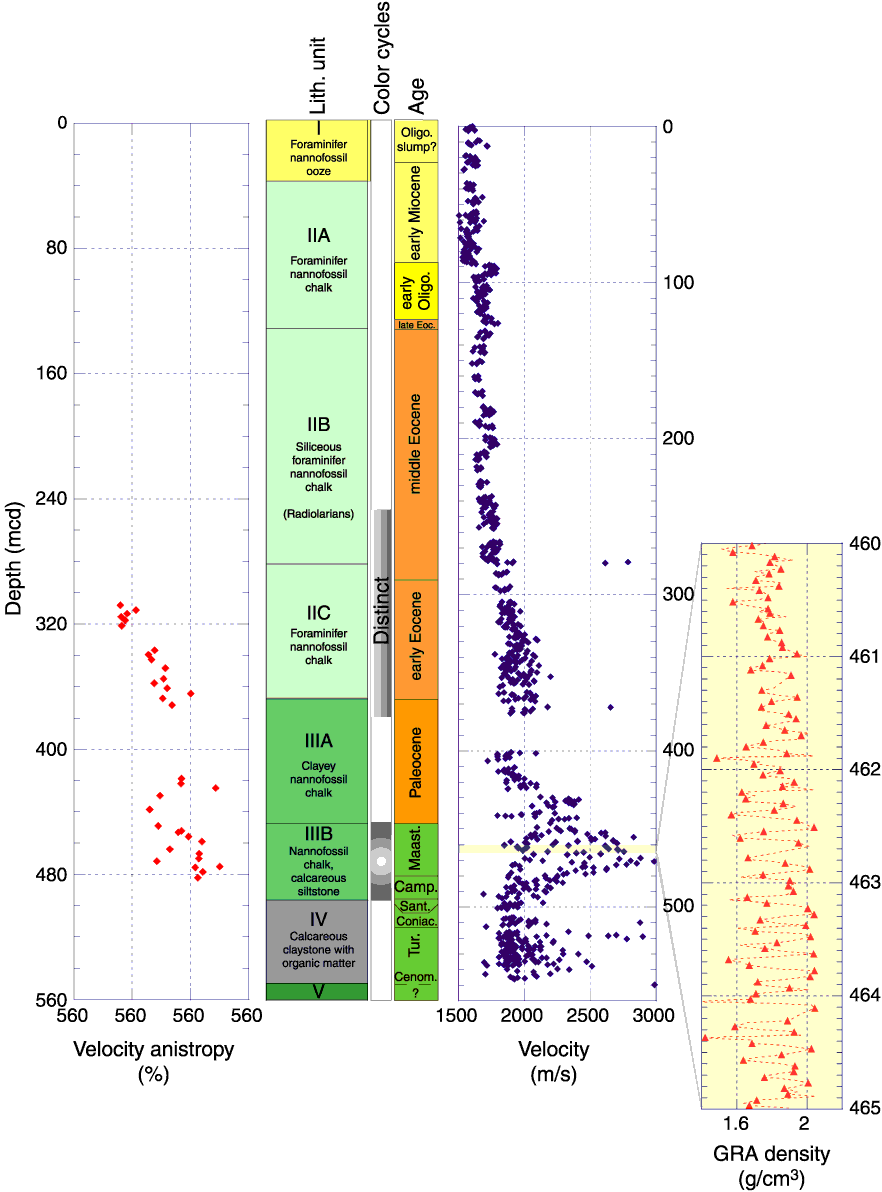
Figure F29. Acoustic velocity and velocity anisotropy measured on samples from Hole 1259B. Variation in GRA density over a 5-m interval (every third datum plotted with no smoothing or interpolation) is shown to account for the observed variability in both the velocity and velocity anisotropy between 400 and 500 mcd. For anisotropy calculations, see "Physical Properties" in the "Explanatory Notes" chapter.


![]()